Gold Price Analysis: XAU/USD sellers need downside break of $1,889 for re-entry – Confluence Detector

Having surged for consecutive eight quarters, gold kick-starts October on a positive note, currently up 0.38% intraday to around $1,893, before Thursday’s European session. In doing so, the metal defies the previous day’s downbeat performance that dragged the quote from one week high.
While searching for reasons in today’s quiet session, the US dollar weakness could be spotted as the main catalyst. American policymakers’ inability to agree on the much-awaited stimulus seems to play a role in the latest weakness of the greenback. As portraying the same, the US dollar index (DXY) drops 0.15% intraday to 93.70 as we write.
It should also be noted that the surging fears of the coronavirus (COVID-19) and Brexit uncertainty are additional pushes for the gold buyers.
Key levels to watch
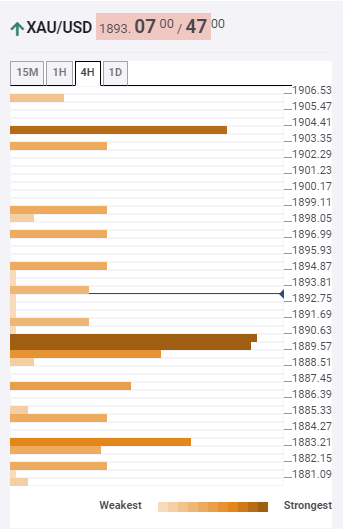
Out own Technical Confluences Indicator portrays the yellow metal’s positive moves unless it drops below $1,889 level comprising 100 and 200 SMA on a 15-minute chart as well as the middle band of the Bollinger on the hourly formation of the chart.
Meanwhile, the $1,990 round-figures, also comprising 38.2% Fibonacci retracement of weekly plays offer immediate support.
Should the quote drops below $1,989, 23.6% Fibonacci retracement of the metal’s one-month moves, around $1,883, will be in the spotlight.
On the contrary, $1,900 and the 38.2% Fibonacci retracement of the one-month waves, near $1,904, can restrict the bullion’s short-term upside.
Here is how it looks on the tool
About the Confluence Detector
The TCI (Technical Confluences Indicator) is a tool to locate and point out those price levels where there is a congestion of indicators, moving averages, Fibonacci levels, Pivot Points, etc. Knowing where these congestion points are located is very useful for the trader, and can be used as a basis for different strategies.
Author

Anil Panchal
FXStreet
Anil Panchal has nearly 15 years of experience in tracking financial markets. With a keen interest in macroeconomics, Anil aptly tracks global news/updates and stays well-informed about the global financial moves and their implications.