|

Gold Price Analysis: XAU/USD pulls back from $2,070 as markets hunker down for holidays

  • Gold pulls back after testing $2,070 ahead of Friday’s pre-holiday close.
  • Rising investor bets of faster, more frequent Fed rate cuts squeeze Gold higher.
  • US inflation continues to cool off, Treasuries ease back amidst risk appetite recovery.

XAU/USD briefly tested above $2,070 on Friday before paring back toward the day’s opening bids. With the Federal Reserve’s (Fed) main interest rate at a 22-year high, markets are incredibly eager for the Fed to begin cutting interest rates, and receding US inflation is pinning investor hopes of an accelerated pace of Fed rate cuts in 2024.

The US Annualized Core Personal Consumption Expenditures (PCE) Price Index in November grew by 3.2% from the same time last year, easing back from market forecasts of 3.3% and declining further from the previous period’s 3.4% (which was also revised down from 3.5%).

Read More: US PCE inflation softens to 2.6% from a year ago vs. 2.8% expected

With US inflation easing back, markets are applying downside pressure to the US Dollar and bidding up Spot Gold in anticipation of Fed rate cuts that may have run too far ahead of what the Fed will be willing to execute; the Fed’s dot plot of interest rate expectations show a median forecast of 75 basis points in rate cuts through the end of 2024. By comparison, markets are currently pricing in bets of 160 basis points in cumulative rate cuts, with some particularly over-eager market participants betting on a rate cut as soon as next March.

With markets wrapping up the last full trading week of 2023 and gearing up for the holiday market break, Friday’s early action saw a notable reversal as the US Dollar pared back the day’s losses and Gold retreated back towards the day’s opening bids.

XAU/USD Technical Outlook

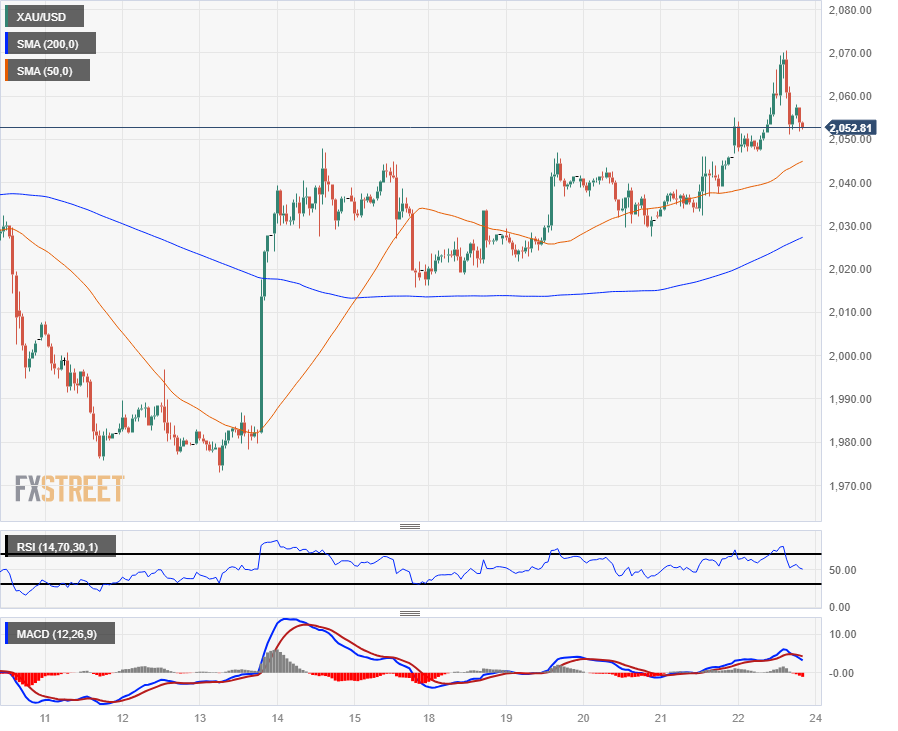
Spot Gold climbed over 1.10% bottom-to-top on Friday in a last-minute bull run before hitting the wall at $2,070 and reversing back toward Friday’s open near $2,050. 

Intraday action in the XAU/USD has been incredibly well-bid as of late, outpacing the 200-hour Simple Moving Average (SMA) since breaking to the topside of the moving average last week near $2,020.

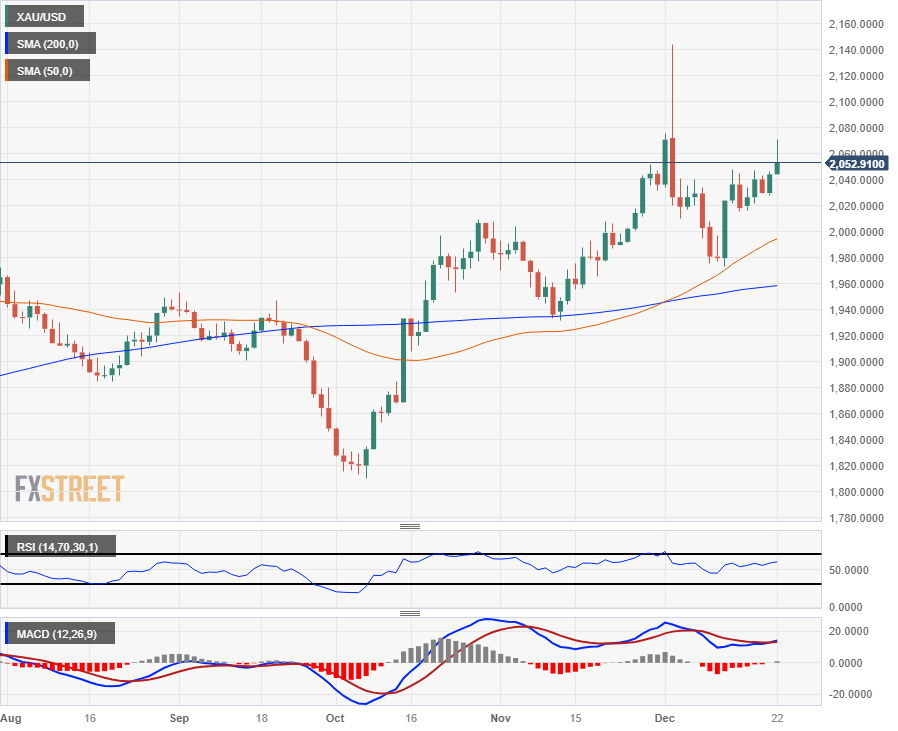
A higher-lows pattern has baked into the XAU/USD on daily candles since Spot Gold bottomed out near $1,820 in early October, and long-term technical support is coming from the 200-day SMA rising into $1,960.

December’s early rally into all-time highs has left near-term Gold bids stranded in bull country, and XAU/USD will have to fall back below the $2,000 major handle before bearish patterns can begin to develop.

XAU/USD Hourly Chart

XAU/USD Daily Chart

XAU/USD Technical Levels

XAU/USD

Overview
Today last price2053.23
Today Daily Change9.05
Today Daily Change %0.44
Today daily open2044.18
 
Trends
Daily SMA202024.72
Daily SMA501992.17
Daily SMA1001946.88
Daily SMA2001957.87
 
Levels
Previous Daily High2046.09
Previous Daily Low2027.56
Previous Weekly High2047.93
Previous Weekly Low1973.13
Previous Monthly High2052.03
Previous Monthly Low1931.67
Daily Fibonacci 38.2%2039.01
Daily Fibonacci 61.8%2034.64
Daily Pivot Point S12032.46
Daily Pivot Point S22020.75
Daily Pivot Point S32013.93
Daily Pivot Point R12050.99
Daily Pivot Point R22057.81
Daily Pivot Point R32069.52

Author

Joshua Gibson

Joshua joins the FXStreet team as an Economics and Finance double major from Vancouver Island University with twelve years' experience as an independent trader focusing on technical analysis.

More from Joshua Gibson
Share:

Markets move fast. We move first.

Orange Juice Newsletter brings you expert driven insights - not headlines. Every day on your inbox.

By subscribing you agree to our Terms and conditions.

Editor's Picks

EUR/USD holds above 1.1750 due to cautious trade before FOMC Minutes

EUR/USD holds ground after four days of little losses, trading around 1.1770 during the Asian hours on Tuesday. The pair remains steady as US Dollar moves little amid market caution ahead of the Federal Open Market Committee December Meeting Minutes due later in the day, which could offer insights into the Federal Reserve’s 2026 outlook.

GBP/USD finds key support near 1.35 despite year-end grind

GBP/USD remains bolstered on the high end as markets grind through the last trading week of the year. Cable caught a bullish tilt to keep price action on the high side of the 1.3500 handle, though year-end holiday volumes are unlikely to see significant progress in either direction as 2025 draws to a close.

Gold gains on Fed rate cut bets, safe-haven demand

Gold price edges higher above $4,350 during the Asian trading hours on Tuesday. The precious metal recovers some lost ground after falling 4.5% in the previous session, which was gold's largest single-day loss since October. Increased margin requirements on gold and silver futures by the Chicago Mercantile Exchange Group, one of the world’s largest trading floors for commodities, prompted widespread profit-taking and portfolio rebalancing.

Solana risks correction within descending wedge as bearish bets rise

Solana hovers above $120 at press time on Tuesday after a nearly 2% decline on Monday. The SOL-focused Exchange Traded Funds see renewed interest after recording their lowest weekly inflow last week.

Economic outlook 2026-2027 in advanced countries: Solidity test

After a year marked by global economic resilience and ending on a note of optimism, 2026 looks promising and could be a year of solid economic performance. In our baseline scenario, we expect most of the supportive factors at work in 2025 to continue to play a role in 2026.

Crypto market outlook for 2026

Year 2025 was volatile, as crypto often is.  Among positive catalysts were favourable regulatory changes in the U.S., rise of Digital Asset Treasuries (DAT), adoption of AI and tokenization of Real-World-Assets (RWA).