Gold Price Analysis: XAU/USD levels to watch ahead of critical US data – Confluence Detector

Renewed hopes of a potential US fiscal stimulus deal, helped Gold (XAU/USD) clinched two straight days of gains, as the XAU bulls remained hopeful of new funds to lift the prices northwards. President Donald Trump’s offer of $1.8 trillion in fiscal aid on Thursday helped narrow Wall Street losses and stall the US dollar rally.
Despite the market optimism, gold struggles to extend the advance above $1900, as investors turn cautious ahead of the critical US Retail Sales and Michigan Consumer Sentiment data due later on Friday. Let’s take a look at gold technical charts, as it remains on track to book a weekly loss.
Gold: Key resistances and supports
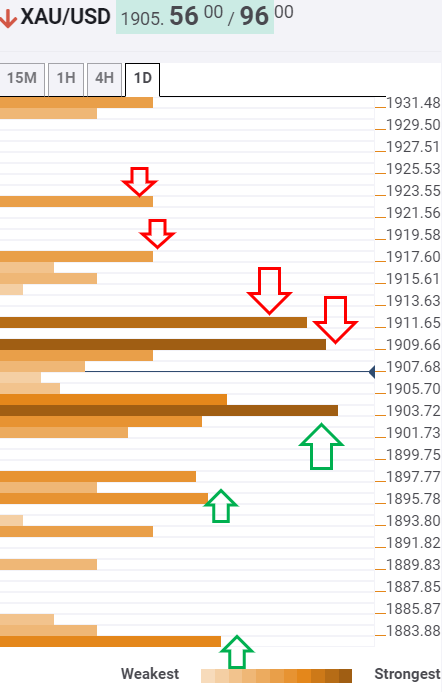
The Technical Confluences Indicator shows that the yellow metal is stuck in a narrow range so far this Friday, now confronting the immediate upside barrier at $1910, which is the convergence of the previous day high and Bollinger Band 15-minutes Upper.
The next significant resistance is seen at $1912.50, the intersection of the previous high on four-hour and SMA5 one-day.
Only a sustained move above the latter could revive the bullish momentum, as the buyers aim for $1917, the Fibonacci 23.6% one-week. Further up, the pivot point one-day R2 at $1922 could likely challenge the bulls’ commitment.
On the flip side, a move below the dense cluster of support levels around $1904/02 would trigger a fresh leg down in the spot. That confluence area comprises of Fibonacci 38.2% one-month, SMA5 four-hour and SMA200 one-hour.
The next soft downside cap is aligned at $1985, where the SMA100 four-hour coincides with the Fibonacci 61.8% one-week.
A powerful support of the Fibonacci 23.6% one-month at $1883 is the level to beat for the bears.
Here is how it looks on the tool
About Confluence Detector
The Confluence Detector finds exciting opportunities using Technical Confluences. The TC is a tool to locate and point out those price levels where there is a congestion of indicators, moving averages, Fibonacci levels, Pivot Points, etc. Knowing where these congestion points are located is very useful for the trader, and can be used as a basis for different strategies.
Author

Dhwani Mehta
FXStreet
Residing in Mumbai (India), Dhwani is a Senior Analyst and Manager of the Asian session at FXStreet. She has over 10 years of experience in analyzing and covering the global financial markets, with specialization in Forex and commodities markets.


