Gold Price Analysis: XAU/USD keeps $1900 in sight while above key $1871 cap – Confluence Detector
- Gold price books third straight weekly gain, $1900 remains in sight.
- Growing inflation concerns counter Fed’s tapering hints.
- Gold could stage a correction before targeting $1,900.

Gold price retested three-month highs of $1890, although settled the week near $1880 levels, registering the third straight week of gains. Gold price remained undeterred by the FOMC minutes, which offered subtlest hints on tapering, as growing inflation risks continued to support the traditional inflation hedge. Further, persistent weakness in the US dollar and the Treasury yields, amid expectations of a faster vaccine-driven global economic recovery, also benefited gold. Additionally, the brutal crypto market crash helped keep the sentiment buoyed around the safe-haven gold.
Heading into a fresh week, the inflation narrative will continue to have a significant impact on gold trades. Meanwhile, Fedspeak, US Preliminary GDP and Consumer Durable Goods data could offer some fresh trading insights.
Read: Gold is stable and strong in the face of crypto goofiness
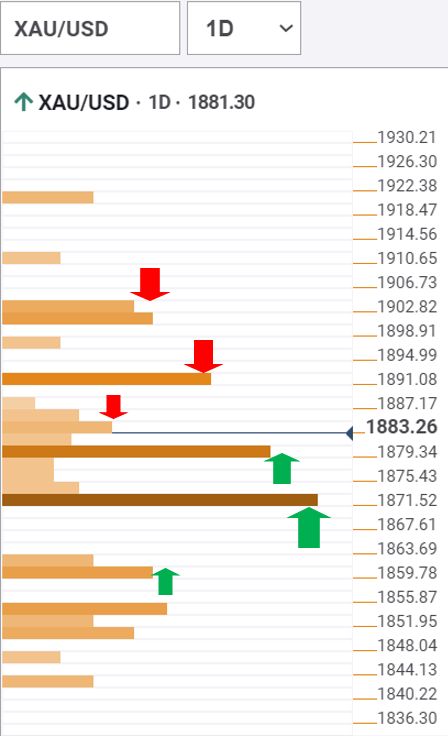
Gold Price: Key levels to watch
The Technical Confluences Detector shows that gold price remains stuck between two key barriers on either side, following the weekly close at $1881.
To the downside, immediate support is seen at $1879, the confluence of the Fibonacci 61.8% one-day and Fibonacci 23.6% one-week and SMA5 four-hour.
A powerful cushion at $1871 could likely limit any retracement from higher levels. That support is the convergence of the previous day low, pivot point one-day S1 and Fibonacci 38.2% one-week.
Acceptance below the latter could trigger a drop towards $1858, where the Fibonacci 161.8% one-day coincides with the Fibonacci 61.8% one-week.
Alternatively, if the intersection of the previous high four-hour and Fibonacci 38.2% one-day at $1883 is taken out, gold price could target the next upside barrier at $1890.
At that point, the previous week high, previous day high and pivot point one-day R1 meet.
Further north, fierce resistance at $1900 is likely to challenge the bullish traders. That is the convergence of the pivot point one-month R3, pivot point one-week R1 and pivot point one-day R2.
Here is how it looks on the tool
About Technical Confluences Detector
The TCD (Technical Confluences Detector) is a tool to locate and point out those price levels where there is a congestion of indicators, moving averages, Fibonacci levels, Pivot Points, etc. If you are a short-term trader, you will find entry points for counter-trend strategies and hunt a few points at a time. If you are a medium-to-long-term trader, this tool will allow you to know in advance the price levels where a medium-to-long-term trend may stop and rest, where to unwind positions, or where to increase your position size.
Author

Dhwani Mehta
FXStreet
Residing in Mumbai (India), Dhwani is a Senior Analyst and Manager of the Asian session at FXStreet. She has over 10 years of experience in analyzing and covering the global financial markets, with specialization in Forex and commodities markets.


