|

Gold Price Analysis: XAU/USD eyes monthly top near $1,907 as Trump signs covid aid package – Confluence Detector

Gold Price Analysis: XAU/USD eyes monthly top near $1,907 as Trump signs covid aid package – Confluence Detector

Gold prices stay positive near a one-week high, currently up 0.80% while easing from the intraday high of $1,900.35 to $1,895, during early Monday. In doing so, the yellow metal extends the last Wednesday’s recovery moves from $1,859 toward the monthly top as the market’s sentiment improve on US President Donald Trump’s signing of the coronavirus (COVID-19) aid package.

Following his initial rejection, Trump surprised global markets during the early Asian trading while signing the US covid aid package for $600 paycheck and an additional $300 weekly unemployment supplement, per the New York Times.

Read: Breaking: President Trump signs coronavirus relief bill

Also supporting the market sentiment could be the extension of Brexit optimism and a lack of data/events amid the year-end holiday season.

Gold: Key levels to watch

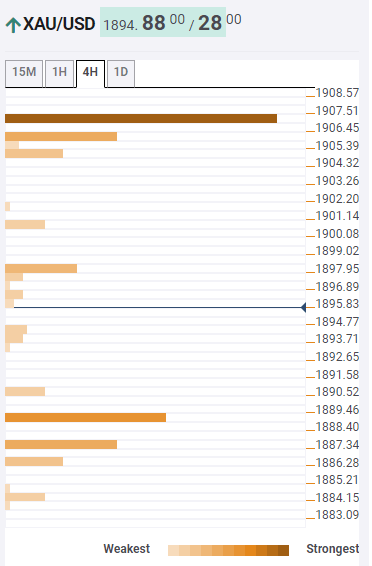
Technically, the yellow metal’s ability to stay past 61.8% Fibonacci retracement on the monthly chart, around $1,889, propels the bulls to eye 100-SMA on one day (1D), near $1,898 offers as an immediate target ahead of the $1,900 round-figure.

However, Pivot Point one-month (M1) Resistance 1, coupled with the monthly peak surrounding $1,907 lures the gold buyers for now while November’s top near $1,965 can lure the bullion buyers afterward.

Meanwhile, a downside break of $1,889 level, resistance turned into support, can offer short-term support during the quote pullback moves.

During the commodity’s weakness past-$1,889, 5-SMA on four-hour (4H) near $1,884 and the previous week’s low near $1,855 could gain the market’s attention.

Here is how it looks on the tool
fxsoriginal

About Confluence Detector

The TCI (Technical Confluences Indicator) is a tool to locate and point out those price levels where there is a congestion of indicators, moving averages, Fibonacci levels, Pivot Points, etc. Knowing where these congestion points are located is very useful for the trader, and can be used as a basis for different strategies.

Learn more about Technical   Confluence

Author

Anil Panchal

Anil Panchal

FXStreet

Anil Panchal has nearly 15 years of experience in tracking financial markets. With a keen interest in macroeconomics, Anil aptly tracks global news/updates and stays well-informed about the global financial moves and their implications.


More from Anil Panchal
Share:

Editor's Picks

AUD/USD remains depressed below 0.6750 after RBA minutes

AUD/USD treads water below 0.6750 in Asia on Tuesday, struggling near ten-month lows. The pair fails to find any inspiration from RBA Governor Bullock’s hawkish remarks. Moreover, Minutes from the November RBA meeting also had little impact on the Australian Dollar amid a bullish US Dollar undertone, bolstered by firming Fed hike bets and geopolitical uncertainties.

USD/JPY holds steady around 156.50 as 'Yentervention' risks loom

USD/JPY is consolidating around mid-156.00s in the Asian session on Tuesday as traders stay on high alert amid speculation that authorities will step in to support the Japanese Yen. Meanwhile, the US Dollar holds its recent gains at a 19-month high, amid firming Fed rate-hike bets and geopolitical uncertainty. This, along with the wide US-Japan rate differential, acts as a tailwind for the pair.


Gold bulls seem hesitant below $3,900 as Fed rate hike bets offset softer USD

Gold clings to modest intraday recovery gains, though it remains below the $3,900 mark through the early European session, and near its lowest level since October 2025, which it touched the previous day. The US Dollar pulls back slightly following the recent strong rally to a 19-month peak, offering some support to the commodity. However, firming US Fed rate-hike expectations and geopolitical uncertainties could limit any meaningful USD fall. This caps the precious metal, warranting some caution for bullish traders.

Pi Network sinks to record low of $0.0551 as bears dominate

Pi Network extends its losing streak, hitting a new all-time low of $0.0551 on Tuesday as bearish pressure intensifies. Weakening derivatives metrics suggest bears remain in control. In addition, deteriorating technical indicators point to elevated downside risk, despite oversold conditions that could trigger a short-term relief bounce.

The week ahead: Questions for the new Nvidia CEO, Anthropic’s IPO and economic data dump
The tech stock rout does not look to be over, and could be broadening as we start a new week. Nvidia’s stock price is lower by another 2% in the pre market, and its rivals, that had benefited from the chip giant’s initial demise, are also playing catch up this morning. AMD’s share price is lower by 4.2% in early trading, even though it eked out a gain last week.
Gold isn't being sold for thew reason most people think
Gold (XAU/USD) remains under heavy selling pressure on Monday, hitting its lowest level in 13 months. The precious metal is struggling to recover despite escalating geopolitical tensions in the Middle East, a backdrop that would normally encourage investors to seek protection in safe-haven assets. However, the main driver behind Gold's decline is not the geopolitical uncertainty itself.