Gold Price Analysis: XAU/USD eyes $1753 amid plenty of health support levels – Confluence Detector

Gold (XAU/USD) takes a breather after the two-day recovery rally but holds well above the $1700 level. The returns on the US Treasuries resume the upside on the back of the revival of the reflation theme after Congress passed the $1.9 trillion stimulus bill on Wednesday.
Gold traders digest the weak US inflation report while awaiting US President Joe Biden’s address to the nation later on Thursday.
Ahead of that, let’s see how gold is positioned technically.
Gold Price Chart: Key resistance and support levels
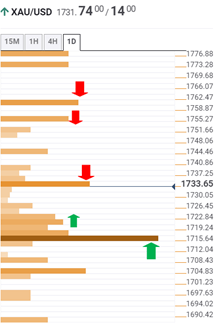
The Technical Confluences Detector shows that gold needs to rise above a dense cluster of resistance levels stacked up around $1738-$1740 levels, in order to test a major hurdle at $1743, which is the pivot point one-week R1.
Further up, the XAU bulls could face stiff resistance at $1753, which is the Fibonacci 23.6% one-month.
The buyers will then target $1760, the confluence of the previous week high, Bollinger Band one-day Middle.
To the downside, strong support around $1725-$1723 would limit the declines. That area is the confluence of the Fibonacci 23.6% one-day, previous low four-hour and SMA5 four-hour.
The powerful cushion at $1716 is the last resort for the bulls. At that point, the SMA200 one-hour coincides with the Fibonacci 38.2% one-week and Fibonacci 61.8% one-day.
Here is how it looks on the tool
About Technical Confluences Detector
The TCD (Technical Confluences Detector) is a tool to locate and point out those price levels where there is a congestion of indicators, moving averages, Fibonacci levels, Pivot Points, etc. Knowing where these congestion points are located is very useful for the trader, and can be used as a basis for different strategies.
Author

Dhwani Mehta
FXStreet
Residing in Mumbai (India), Dhwani is a Senior Analyst and Manager of the Asian session at FXStreet. She has over 10 years of experience in analyzing and covering the global financial markets, with specialization in Forex and commodities markets.

















