Gold Price Analysis: XAU/USD bears target $1887 amid health resistance levels – Confluence Detector
- Gold price remains on the defensive amid notable US dollar demand.
- Risk-off mood, subdued Treasury yields offer some comfort to gold bulls.
- Gold Price Forecast: XAU/USD risks further falls as technical setup turns bearish

Gold price is consolidating just below the $1900 level, as the bears take a breather after Tuesday’s $25 decline from five-month tops of $1917. The main catalyst behind gold’s drop remains the US dollar’s advance, in the wake of strong US ISM Manufacturing PMI. A pick-up in the US manufacturing kept bets alive for the Fed’s tapering. Meanwhile, tepid risk sentiment also underpins the dollar’s demand, despite subdued yields. However, gold bulls remain hopeful amid growing inflation concerns and a revival in India’s demand for the metal.
In absence of the first-tier economic data from the US, the broader market sentiment and the dollar dynamics will continue to remain in play. The main market-moving event for this week remains the US Nonfarm Payrolls.
Read: Gold Weekly Forecast: XAU/USD bulls not yet ready to give up on additional gains
Gold Price: Key levels to watch
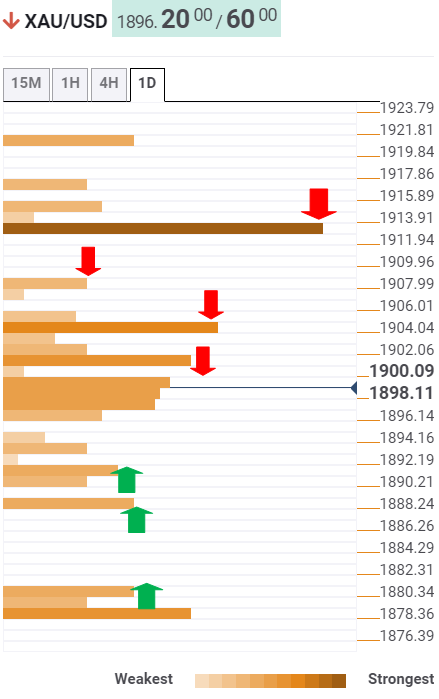
The Technical Confluences Detector shows that gold price is struggling around $1897, where a dense cluster of resistance levels is stacked up.
That comprises of the Fibonacci 23.6% one-day, Fibonacci 38.2% one-week and SMA5 four-hour.
The next critical hurdle for gold price awaits at $1901, the confluence of the SMA5 one-day and previous high four-hour.
The Fibonacci 23.6% one-week at $1904 could limit the further upside, as the bulls remain on track to test the Fibonacci 61.8% one-day at $1908.
A powerful barrier around $1913 will be a tough nut to crack for gold buyers. The previous week and month high coincide at that point.
To the downside, minor support awaits at the previous day low of $1892.
The next relevant support is seen at the Fibonacci 61.8% one-week at $1887.
The pivot point one-week S1 at $1880 could come to the rescue of gold bulls.
Here is how it looks on the tool
About Technical Confluences Detector
The TCD (Technical Confluences Detector) is a tool to locate and point out those price levels where there is a congestion of indicators, moving averages, Fibonacci levels, Pivot Points, etc. If you are a short-term trader, you will find entry points for counter-trend strategies and hunt a few points at a time. If you are a medium-to-long-term trader, this tool will allow you to know in advance the price levels where a medium-to-long-term trend may stop and rest, where to unwind positions, or where to increase your position size.
Author

Dhwani Mehta
FXStreet
Residing in Mumbai (India), Dhwani is a Senior Analyst and Manager of the Asian session at FXStreet. She has over 10 years of experience in analyzing and covering the global financial markets, with specialization in Forex and commodities markets.


