|

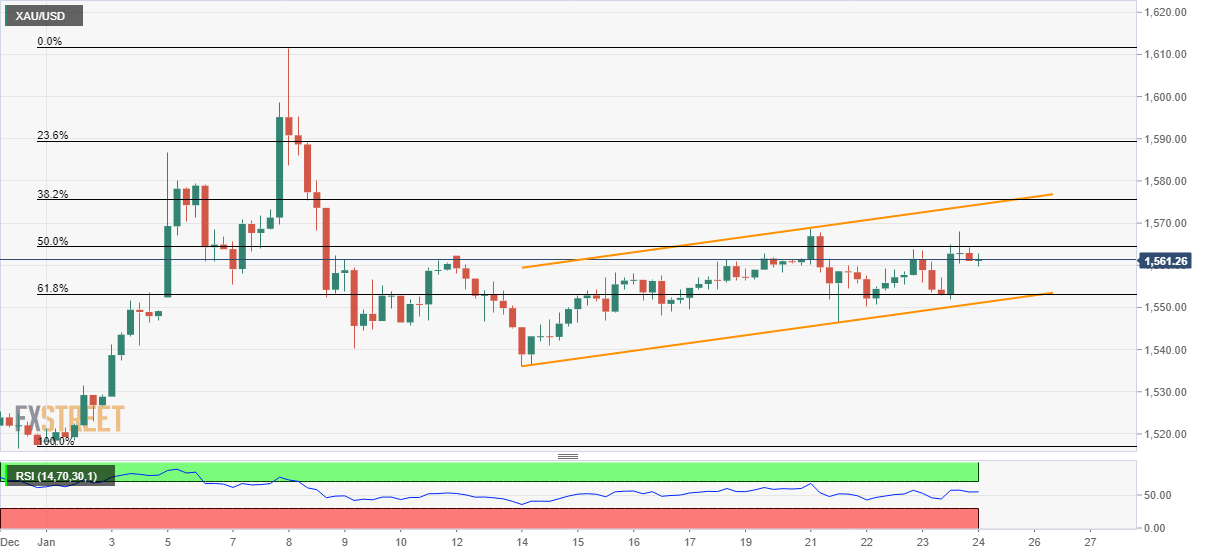
Gold Price Analysis: Portrays rising trend-channel on H4, Coronavirus in focus

  • Gold fails to cross intermediate Fibonacci resistance while keeping eight-day-old bullish technical formation.
  • January 14 lows will please sellers during the channel’s breakdown, 23.6% Fibonacci retracement can challenge buyers alternatively.

Gold prices lack momentum while trading around $1,561.50 during early Friday. Even so, the bullion stays inside a short-term ascending trend-channel formation that portrays the strength of the underlying momentum. Also supporting the odds for the yellow metal's rise is the outbreak of China's coronavirus that helps the safe-havens.

With this, buyers can take aim at the formation resistance surrounding $1,574.50 if managed to break 50% Fibonacci retracement of the early-month upside, at $1,564.50.

In a case where the bulls dominate past-$1,575, 23.6% Fibonacci retracement level of $1,590 can offer an intermediate halt during the run-up to $1,600 and then to the monthly high near $1,612.

On the downside, 61.8% Fibonacci retracement and the channel’s support line will question the sellers close to $1,553 and $1,551. Also nearing will be $1,550 round-figure.

Given the bears’ ability to rule below $1,550, the current month’s low of $1,536 and $1,530 could flash on their radars while $1,517 could grab the spotlight afterward.

Gold four-hour chart
Trend: Further recovery expected

Additional important levels

Overview
Today last price1554.53
Today Daily Change-4.25
Today Daily Change %-0.27%
Today daily open1558.78
 
Trends
Daily SMA201544.99
Daily SMA501500.78
Daily SMA1001497.64
Daily SMA2001441.49
 
Levels
Previous Daily High1559.75
Previous Daily Low1550.4
Previous Weekly High1562
Previous Weekly Low1536.35
Previous Monthly High1525.1
Previous Monthly Low1454.05
Daily Fibonacci 38.2%1556.18
Daily Fibonacci 61.8%1553.97
Daily Pivot Point S11552.87
Daily Pivot Point S21546.96
Daily Pivot Point S31543.52
Daily Pivot Point R11562.22
Daily Pivot Point R21565.66
Daily Pivot Point R31571.57

Author

Anil Panchal

Anil Panchal

FXStreet

Anil Panchal has nearly 15 years of experience in tracking financial markets. With a keen interest in macroeconomics, Anil aptly tracks global news/updates and stays well-informed about the global financial moves and their implications.


More from Anil Panchal
Share:

Editor's Picks

GBP/USD off highs, back to 1.3620

GBP/USD remains slightly on the defensive at the end of the week, receding to the low 1.3600s after hitting fresh tops past 1.3670 earlier in the day. Cable’s correction comes after two daily gains in a row and amid a tepid advance in the Greenback, while poor UK data also accompany the downside.

EUR/USD treads water below 1.1700

EUR/USD now trades with modest losses around 1.1670 following another unsuccessful atempt to advance past 1.1700 the figure in a convincing fashion. The pair’s decline follows a maginal rebound in the US Dollar as market participants continue to assess recent US data as well as developments from the US bond market.

Gold keeps rallying toward $4,700, fresh three-month highs

Gold extends its last week's stellar performance into Asian trading on Monday, refreshing three-month highs beyond $4,600. The precious metal capitalizes on persistent US Dollar weakness, following the US Treasury's buyback plan amid fresh US-Canada trade tensions.

Bitcoin, Ethereum and Ripple pause as momentum indicators signal overbought conditions, massive rallies
Bitcoin (BTC), Ethereum (ETH) and Ripple (XRP) hover around key levels on Monday, with a bullish bias but appearing stretched after surging over 23%, 31% and 53% in the previous week. Such a massive rally suggests the top three cryptocurrencies could consolidate or pull back in the short term as traders take profits.
US Dollar Weekly Forecast: Enter Jackson, mind the (budget) Hole
It was not geopolitics, the US-Japan joint FX intervention to support the beleaguered Japanese currency or the omnipresent bets on what the Federal Reserve (Fed) might do in the second half of the year that kept the US Dollar (USD) well on the back foot over the past five days.
$20 billion offered, $2 billion taken: Why Treasury doubled its buyback cap

The US Treasury moved off its own calendar on Wednesday, and that is the part worth sitting with. At 12:32 GMT, the department said it would at least double the size of liquidity support buyback operations in the 10-year to 20-year and 20-year to 30-year sectors, lifting the maximum from $2 billion per operation to at least $4 billion, effective September 9 and running to November 4.














