Gold trades back down to $2,500 after release of US CPI data
- Gold retreats back down to $2,500 after the release of US inflation data.
- Investors are still debating the size of the Fed’s interrest rate cut at its September meeting.
- Whether or not it is a 50 bps cut could strongly impact Gold.

Gold (XAU/USD) touches the top of its range and then falls back down to $2,500 after the release of US inflation data on Wednesday.
The US Consumer Price Index (CPI) rose by 2.5% on an annual basis in August, compared to the 2.9% in July, and below the 2.6% forecast by economists. Monthly CPI rose by 0.2% in line with forecasts and the same as previously, according to data from the US Bureau of Labor Statistics.
Core CPI rose by 3.2% on an annual basis in August, the same as in July and as expected. Monthly core CPI rose by 0.3%, which was above the 0.2% in July and the 0.2% expected.
The US Dollar (USD) rose following the release and Gold fell from where it had been trading in the $2,520s to close to $2,500. Gold is negatively correlated to the US Dollar with gains for the latter negative for the former.
Gold oscillates inside its range before Fed meeting
Gold is broadly oscillating within a range from about $2,480 to $2,530 as investors debate the size of the cut the Federal Reserve (Fed) will make to interest rates at its September 17-18 meeting. Whilst a standard 25 basis points (bps) – or 0.25% – cut is now to be expected, some believe the Fed could opt for a larger 50 bps cut. The latter would boost the attractiveness of Gold in comparison with other assets because it is a non-interest-paying asset.
Gold helped higher by weaker US Dollar
Gold gained an uplift from a weaker US Dollar (USD) early on Wednesday due to the outcome of the Trump-Harris presidential election debate.
According to most analysts, Vice President Kamala Harris came out on top, so the market is discounting former President Donald Trump’s policies to maintain the US Dollar as the world’s reserve currency by penalizing countries who refuse to use it with tariffs.
That said, the effect is likely to be counterbalanced given the former president is also known to advocate for a weaker Dollar because it helps US exports.
On the geopolitical risk front, Israel continues bombing civilian areas in Gaza, and protests by the populace calling for a ceasefire so hostages can be released appear to be falling on deaf ears. The attack on the Al-Mawasi camp, which killed dozens at the start of the week, has drawn condemnation from the international community and snuffed out US efforts at brokering a ceasefire deal.
In the other hotspot, the news of a Ukrainian drone attack on Moscow has probably only ratcheted up tensions, which, if anything, might be increasing safe-haven demand for Gold.
Technical Analysis: Gold rolls over at all-time-highs
Gold (XAU/USD) rolls over close to its all-time-highs and falls back down within its sideways range.
XAU/USD 4-hour Chart
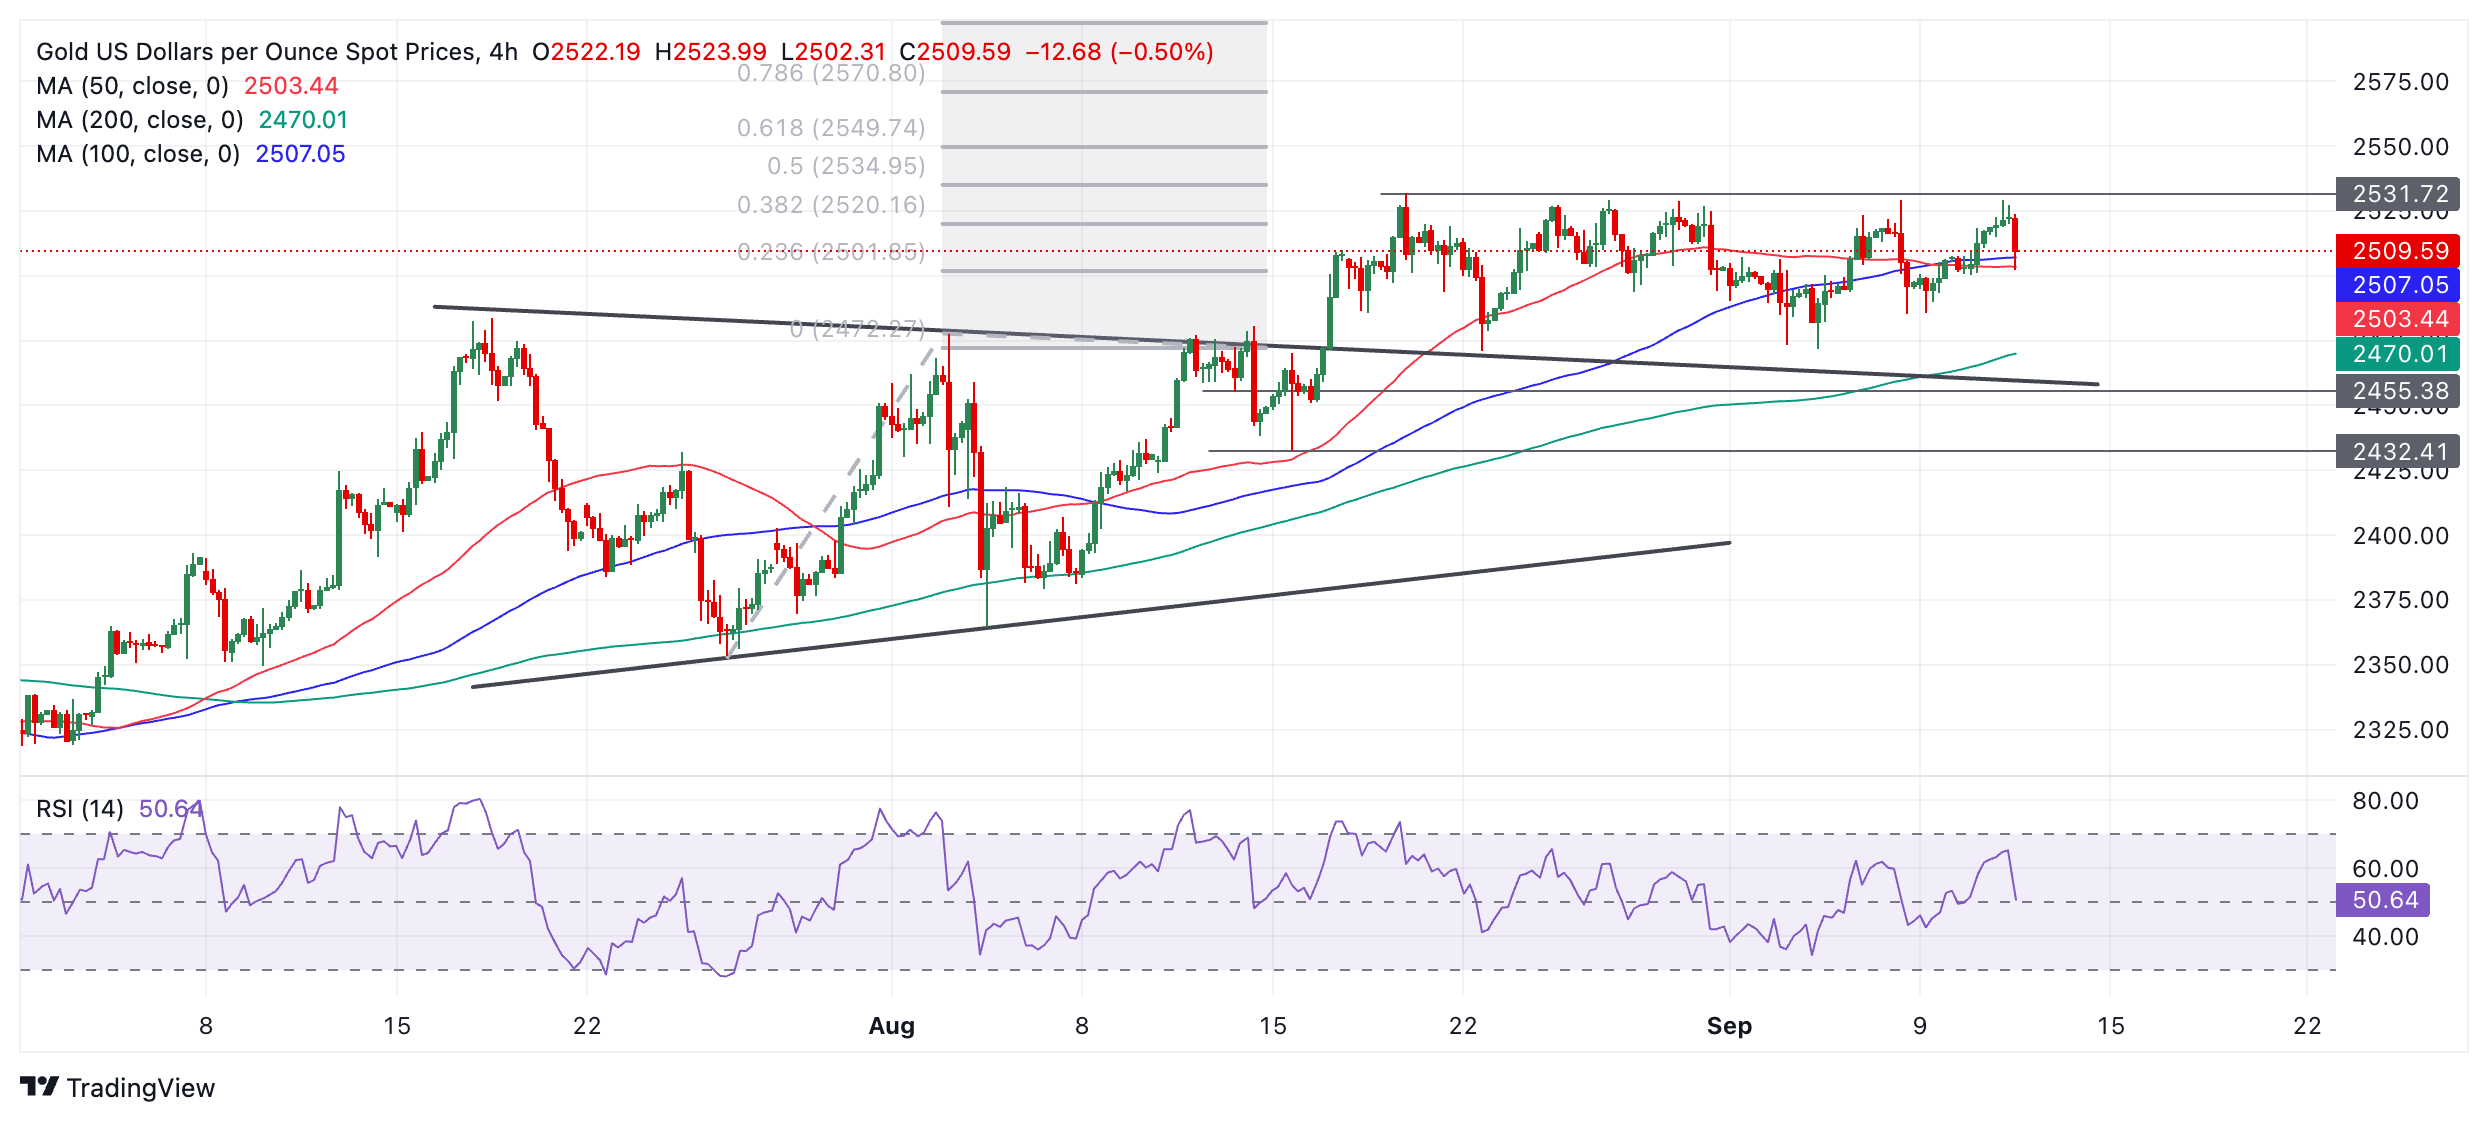
The yellow metal will probably continue to trade up and down within its multi-week range between the $2,480s and the $2,531 record high.
The longer-term trend for Gold is bullish, however, and since “the trend is your friend,” this increases the odds of an eventual breakout higher materializing.
The precious metal has an as-yet unreached bullish target at $2,550, generated after the original breakout from the July-August range on August 14. It will probably finally reach its goal in the end, assuming the uptrend survives.
A break above the August 20 all-time high of $2,531 would provide more confirmation of a continuation higher toward the $2,550 target.
If Gold closes below $2,460, however, it would change the picture and bring the bullish bias into question.
Economic Indicator
Consumer Price Index ex Food & Energy (MoM)
Inflationary or deflationary tendencies are measured by periodically summing the prices of a basket of representative goods and services and presenting the data as the Consumer Price Index (CPI). CPI data is compiled on a monthly basis and released by the US Department of Labor Statistics. The MoM print compares the prices of goods in the reference month to the previous month.The CPI Ex Food & Energy excludes the so-called more volatile food and energy components to give a more accurate measurement of price pressures. Generally speaking, a high reading is seen as bullish for the US Dollar (USD), while a low reading is seen as bearish.
Read more.Last release: Wed Sep 11, 2024 12:30
Frequency: Monthly
Actual: 0.3%
Consensus: 0.2%
Previous: 0.2%
Source: US Bureau of Labor Statistics
The US Federal Reserve has a dual mandate of maintaining price stability and maximum employment. According to such mandate, inflation should be at around 2% YoY and has become the weakest pillar of the central bank’s directive ever since the world suffered a pandemic, which extends to these days. Price pressures keep rising amid supply-chain issues and bottlenecks, with the Consumer Price Index (CPI) hanging at multi-decade highs. The Fed has already taken measures to tame inflation and is expected to maintain an aggressive stance in the foreseeable future.
Author

Joaquin Monfort
FXStreet
Joaquin Monfort is a financial writer and analyst with over 10 years experience writing about financial markets and alt data. He holds a degree in Anthropology from London University and a Diploma in Technical analysis.


