Gold rangebound though long-term prospects look bullish
- Gold is trading in a narrow range as the outlook for a key driver – US interest rates – remains opaque.
- The Fed continues to weigh up the pros and cons of cutting interest rates, a potentially positive event for Gold.
- Multiple geopolitical factors suggest a broadly bullish backdrop for the precious metal.

Gold (XAU/USD) continues trading in a familiar range within the $2,320-$2,330s, just below the 50-day Simple Moving Average (SMA) on Tuesday, amid Futures’ traders “short-covering”, as well as “bargain hunting” by longer-term investors, according to Kitco’s Jim Wyckoff. This could be an accumulation phase as investors position for another rally in Gold given multiple global factors continue to support the secular long view.
Unresolved geopolitical conflicts in the Middle East and Ukraine, a lurch right politically in Europe, Trump, and growing fracture lines along ideological, political, and economic grounds between the East and West – exemplified by the expansion of the BRICS trading confederation – are increasingly posing a threat to the smooth running of global free trade. As a safe-haven in times of crisis and probably the only viable alternative to the dominance of the US Dollar, Gold steps forward as a leading actor on the new world order’s stage.
Gold bulls reigned back by Fed coyness
Gold is trapped in a range as the US Federal Reserve (Fed) remains reluctant to commit to a date for when it will begin cutting interest rates. Gold is a non-interest-paying asset, so there is an opportunity cost to holding it. This opportunity cost continues to remain high as long as the Fed waits. When the Fed does finally start cutting interest rates, however, it will provide a positive back wind for Gold.
Although the Fed’s preferred gauge of inflation, the US Personal Consumption Expenditures (PCE) Price Index, continued to fall in line with expectations in May, reaching 2.6% year-over-year (YoY) – another step closer to the Fed’s 2.0% target – Fed officials speaking after the event still remained coy about committing to cuts.
Richmond Fed President Thomas Barkin talked of “lags” in monetary tightening playing out and cautioned that "services and shelter price-setters still have room to push prices higher." Prior to him, San Francisco Fed President Mary Daly told CNBC that cooling inflation showed that the monetary policy was working as it should, but that it was still too early to tell when it would be appropriate to cut interest rates.
Now traders are awaiting more commentary from Chairman of the Fed Jerome Powell on Tuesday, whilst US jobs data including JOLTS Job Openings and then the Nonfarm Payrolls release on Friday could all color the outlook for interest rates and impact Gold.
US ISM Manufacturing Purchasing Managers Index (PMI) data out on Monday came out below expectations, but this seemed to have little impact on Gold, which continued rallying. Nor did the rise in US Treasury yields, which was put down to the increased likelihood of Donald Trump winning the next presidential election in November, seem to impact Gold. Normally, it would be expected to be negative. Although this might be because of the geopolitical risk Trump carries which is a counterbalancing positive factor for safe-haven Gold.
Market-based bets on when the Federal Reserve could cut interest rates are perhaps more optimistic, continuing to flag a high probability of the Fed cutting interest rates at the September meeting. According to the CME FedWatch tool, which calculates chances using 30-day Fed Funds futures prices, the probability of a cut in (or before) September has popped back up to 65%, from 63% on Monday. It appears to be stabilizing around the mid-60s.
Technical Analysis: Gold meanders below restrictive 50-day SMA
Gold edges lower as it trades along the underside of the 50-day SMA on Tuesday.
Last week, XAU/USD broke above a trendline connecting the “Head” and “Right Shoulder” of a now invalidated Head and Shoulders (H&S) pattern that formed during April, May, and June in the daily chart.
XAU/USD Daily Chart
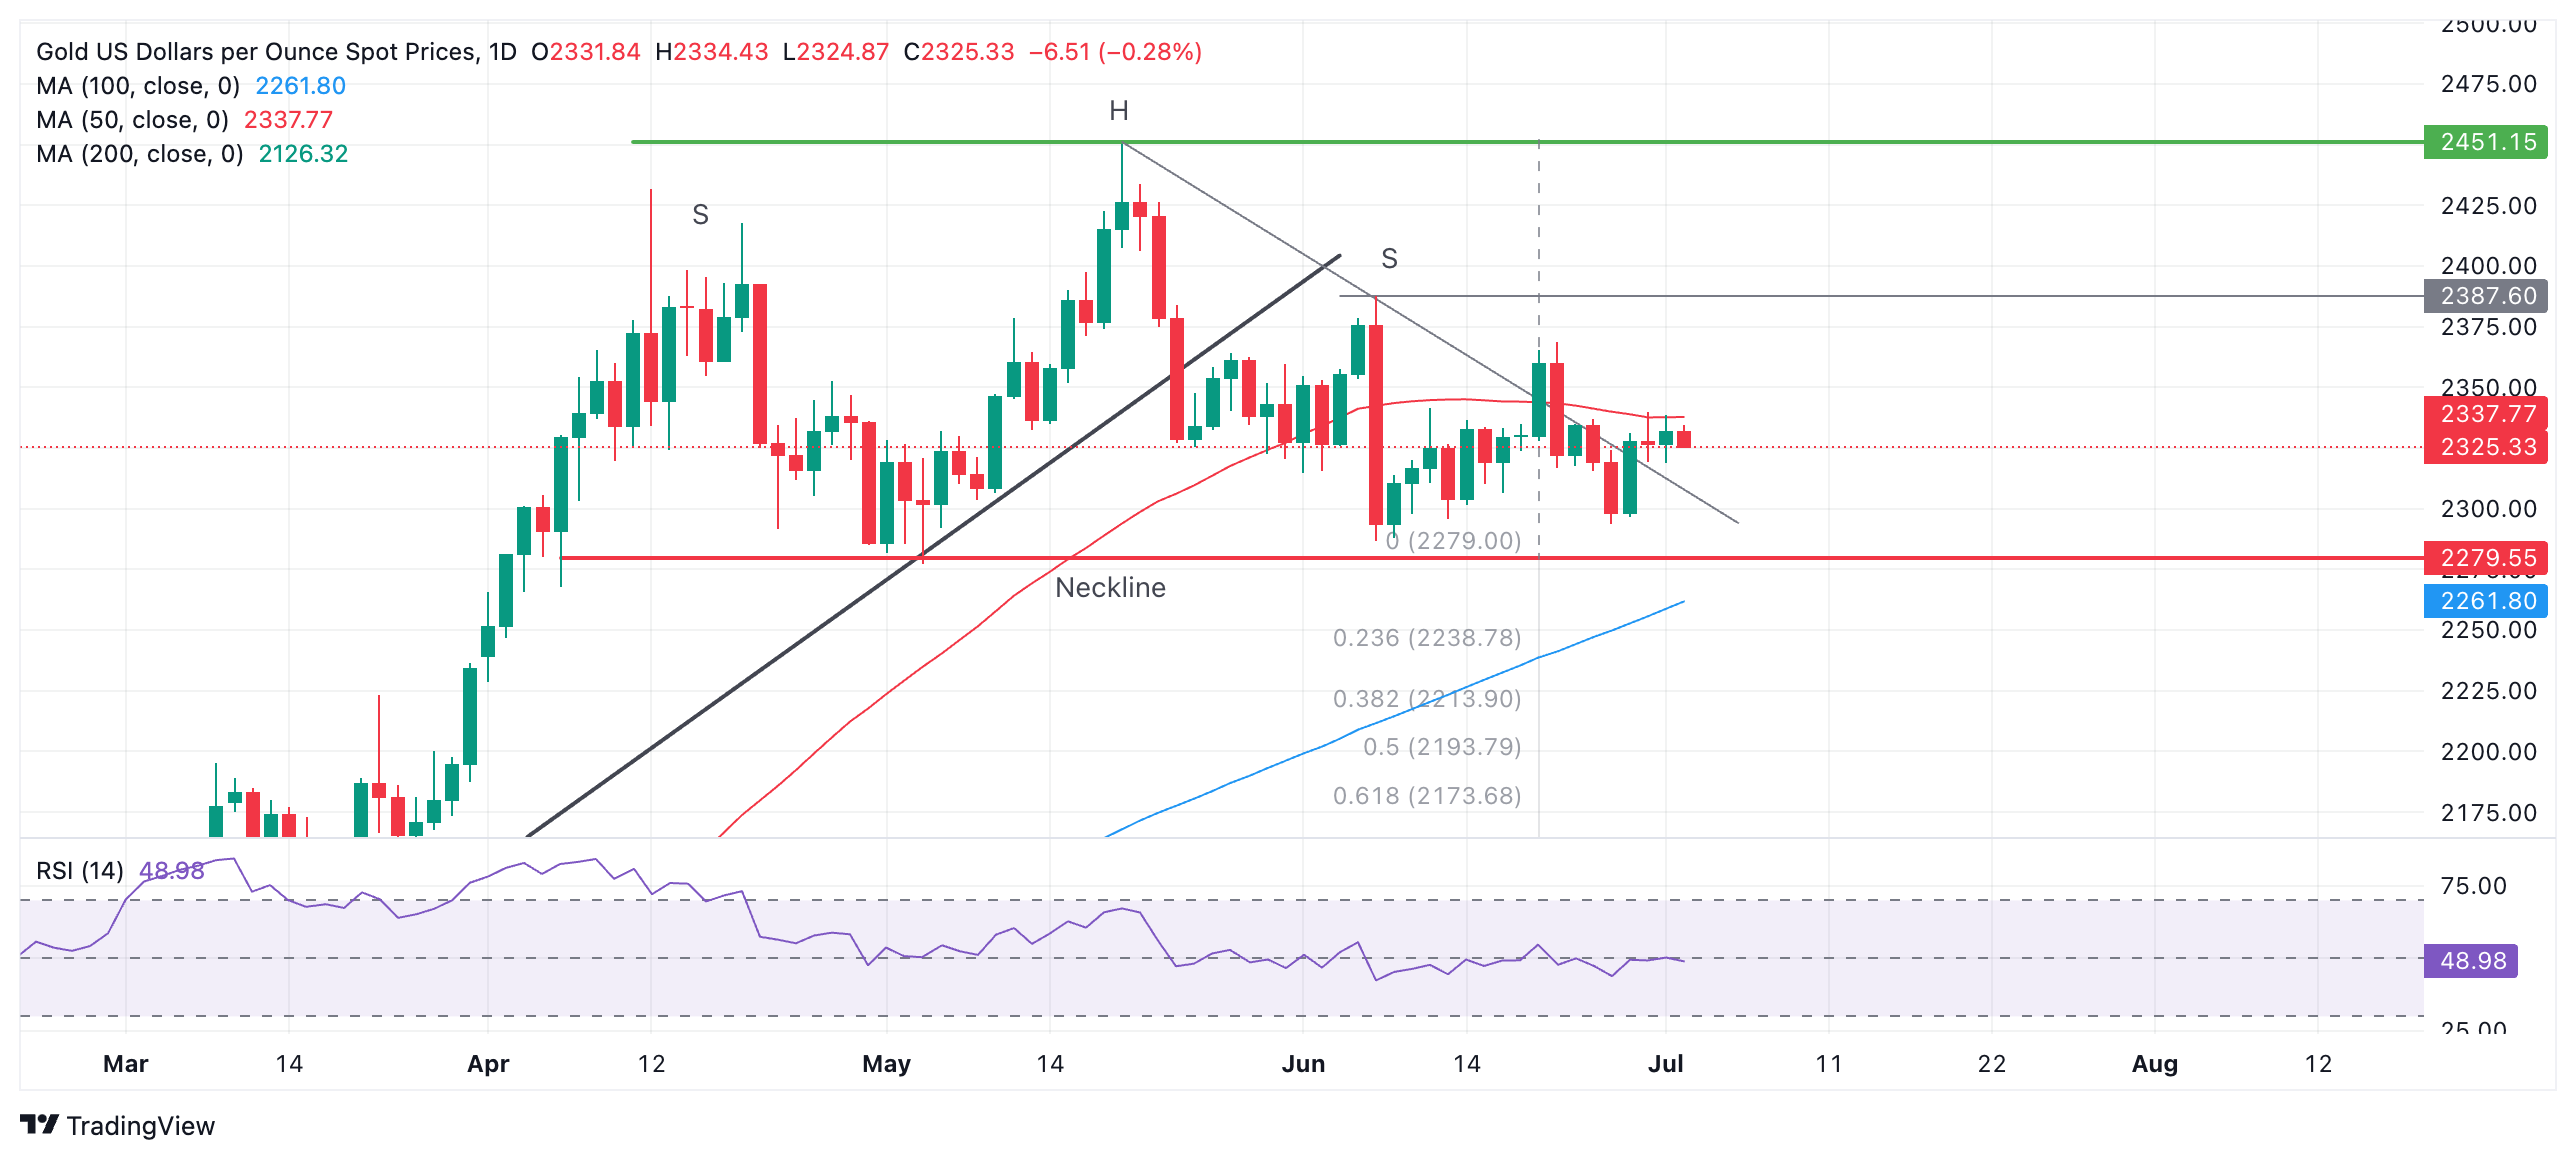
Whilst it is still possible a more complex bearish “multi-shouldered” topping pattern may still be forming, the odds are lower since the trendline break.
Gold could rise to the $2,369 level (the June 21 high) if it breaks above $2,340. The next target above that would be $2,388, the June 7 high.
Alternatively, assuming the compromised topping pattern’s neckline at $2,279 is broken, a reversal lower may still follow, with a conservative target at $2,171, the 0.618 ratio of the height of the pattern extrapolated lower.
The trend is now sideways in both the short and medium term. In the long term, Gold remains in an uptrend.
Economic Indicator
Personal Consumption Expenditures - Price Index (YoY)
The Personal Consumption Expenditures (PCE), released by the US Bureau of Economic Analysis on a monthly basis, measures the changes in the prices of goods and services purchased by consumers in the United States (US). The YoY reading compares prices in the reference month to a year earlier. Price changes may cause consumers to switch from buying one good to another and the PCE Deflator can account for such substitutions. This makes it the preferred measure of inflation for the Federal Reserve. Generally, a high reading is bullish for the US Dollar (USD), while a low reading is bearish.
Read more.Last release: Fri Jun 28, 2024 12:30
Frequency: Monthly
Actual: 2.6%
Consensus: 2.6%
Previous: 2.7%
Source: US Bureau of Economic Analysis
Author

Joaquin Monfort
FXStreet
Joaquin Monfort is a financial writer and analyst with over 10 years experience writing about financial markets and alt data. He holds a degree in Anthropology from London University and a Diploma in Technical analysis.


