|

GBP/USD technical analysis: Sustained break of 1.2755/50 will confirm rising wedge on H1

  • GBP/USD portrays nearly one-week-old rising-wedge bearish formation on the hourly chart.
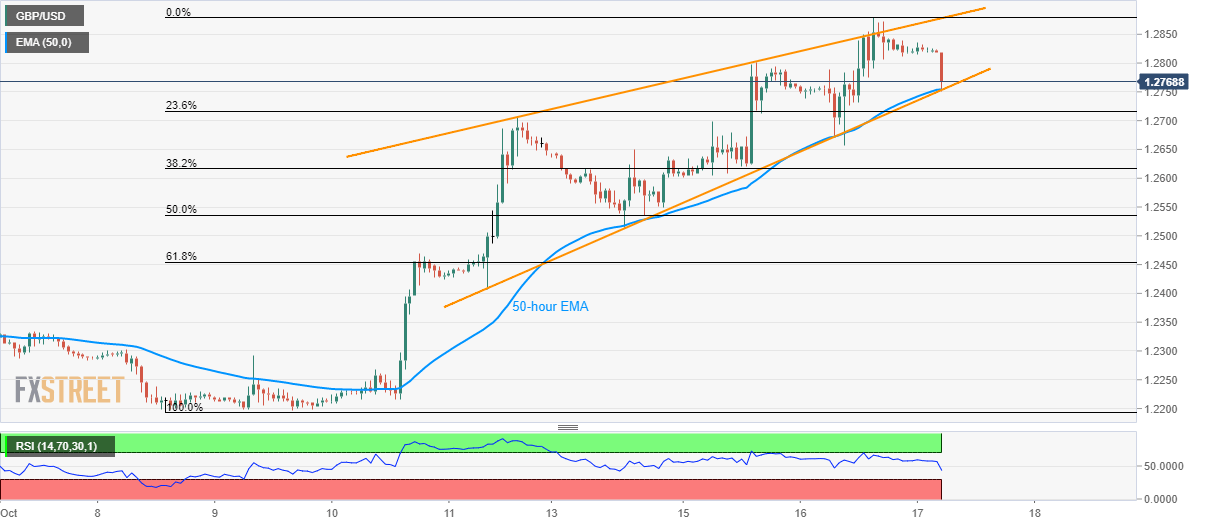
  • 50-hour EMA adds strength to the support.

With the pullback from multi-month high easing worries of the Cable sellers, GBP/USD highlights a bearish chart pattern, rising-wedge, at the top as it declines to 1.2800 while heading into the London open on Thursday.

The bearish formation on the hourly (H1) chart gets confirmed if prices slip below 1.2755/50 support-zone, comprising formation’s lower line and 50-hour Exponential Moving Average (EMA).

In doing so, the fresh downturn towards 61.8% Fibonacci retracement near 1.2450 could be initiated theoretically. However, intermediate halts to 1.2615 and weekly low surrounding 1.2515 can’t be denied.

Should bears refrain from respecting 1.2450, 1.2330 and 1.2200 will be on their radars.

Alternatively, pair’s run-up beyond 1.2850 should recall 1.2915 and 1.3000 mark back to the chart.

GBP/USD hourly chart

Trend: pullback expected

additional important levels

Overview
Today last price1.2802
Today Daily Change-30 pips
Today Daily Change %-0.23%
Today daily open1.2832
 
Trends
Daily SMA201.2423
Daily SMA501.2307
Daily SMA1001.2415
Daily SMA2001.2714
 
Levels
Previous Daily High1.288
Previous Daily Low1.2656
Previous Weekly High1.2707
Previous Weekly Low1.2194
Previous Monthly High1.2583
Previous Monthly Low1.1958
Daily Fibonacci 38.2%1.2794
Daily Fibonacci 61.8%1.2742
Daily Pivot Point S11.2698
Daily Pivot Point S21.2565
Daily Pivot Point S31.2474
Daily Pivot Point R11.2922
Daily Pivot Point R21.3013
Daily Pivot Point R31.3146

Author

Anil Panchal

Anil Panchal

FXStreet

Anil Panchal has nearly 15 years of experience in tracking financial markets. With a keen interest in macroeconomics, Anil aptly tracks global news/updates and stays well-informed about the global financial moves and their implications.

More from Anil Panchal
Share:

Editor's Picks

EUR/USD risks a deeper drop below 1.1750

EUR/USD keeps its vacillating mood in place as the the NA session drwas to a close on Tuesday, hovering below the 1.1800 hurdle amid acceptable gains in the US Dollar. In the meantime, market participants and the FX galaxy are expected to closely follow President Trump’s SOTU speech around 2AM GMT.
 

GBP/USD regains 1.3500 and above

GBP/USD extends its advance for the third day in a row on Tuesday, this time retesting the area beyond the 1.3500 hurdle. Cable’s uptick comes despite decent gains in the Greenback and the dovish message from the BoE’s Bailey at the UK Parliament.

Gold appears offered around $5,150

Gold is giving back a good portion of the recent multi-day rally, receding to the $5,150 zone per troy ounce amid the decent bounce in the US Dollar and mixed US Treasuty yields. In the meantime, markets’ attention remain on upcoming comments from Fed speakers.

Australia CPI to highlight persistent price pressures, backing a hawkish outlook

Australia will release its key set of inflation figures for the month of January on Wednesday, with the Consumer Price Index expected to rise by 3.7%, slightly lower than the 3.8% in the last month of 2025.

The Citrini report: How a debatable AI narrative can shake Wall Street

That AI-related headline alone was enough to rattle investors.US stocks slid sharply on Monday after a widely circulated Citrini Research memo outlined a hypothetical “2028 Global Intelligence Crisis”, warning that rapid AI adoption could push US unemployment into double digits as early as by mid-2028.

XRP pressured by weak ETF flows and declining retail interest

Ripple (XRP) is edging lower, trading above its intraday low of $1.32 at the time of writing on Tuesday. The decline from its weekly opening of $1.39 reflects heightened volatility in the broader cryptocurrency market, accentuated by tariff-triggered uncertainty.