|

GBP/USD Technical Analysis: Sluggish above 200-HMA, 50% Fibonacci

  • GBP/USD nears the key technical confluence.
  • Bearish MACD indicates the return of early-week levels.
  • A nine-day-old descending trend line restricts immediate upside.

GBP/USD stays modestly changed around 1.2915 during the Asian session on Friday.

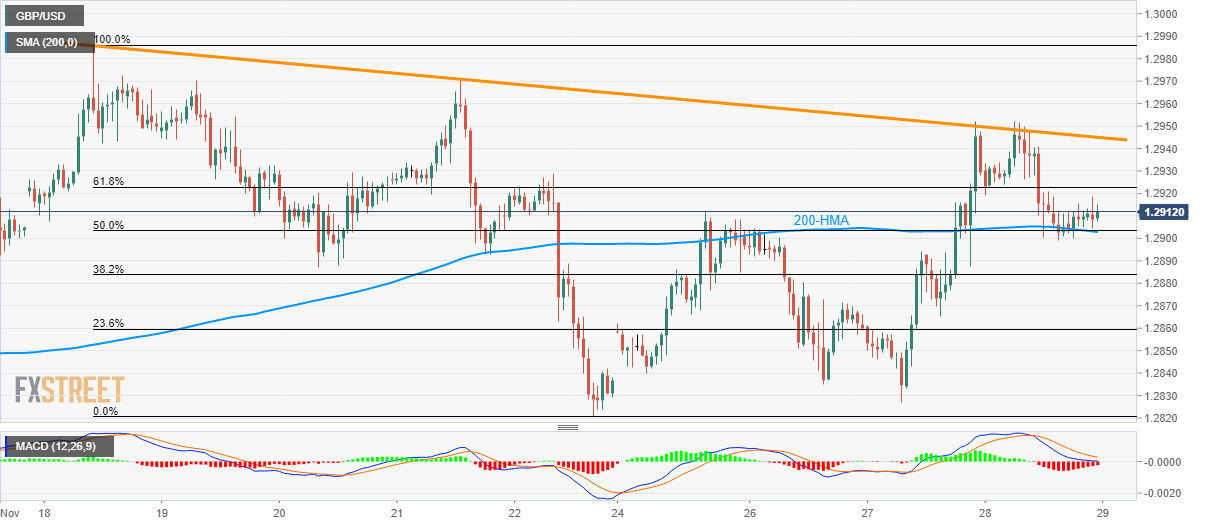
The pair seesaws around 200-hour Simple Moving Average (HMA) and 50% Fibonacci retracement of the previous week’s decline, around 1.2900 mark.

Bearish signals from 12-bar Moving Average Convergence and Divergence (MACD) portrays the pair’s latest sluggish momentum while also favoring declines to Tuesday’s top near 1.2870 on the downside break of 1.2900 support confluence.

Should prices manage to remain strong beyond 1.2900, the 61.8% Fibonacci retracement level of 1.2925 can restrict adjacent rise ahead of highlighting a downward sloping trend line since November 18, at 1.2945.

If bulls manage to cross 1.2945, the monthly high near 1.2985, 1.3000 round-figure and October month high around 1.3015 will be in focus.

GBP/USD hourly chart

Trend: Sideways

additional important levels

Overview
Today last price1.2913
Today Daily Change7 pips
Today Daily Change %0.05%
Today daily open1.2906
 
Trends
Daily SMA201.2883
Daily SMA501.2701
Daily SMA1001.2489
Daily SMA2001.2702
 
Levels
Previous Daily High1.2916
Previous Daily Low1.2827
Previous Weekly High1.2986
Previous Weekly Low1.2821
Previous Monthly High1.3013
Previous Monthly Low1.2194
Daily Fibonacci 38.2%1.2882
Daily Fibonacci 61.8%1.2861
Daily Pivot Point S11.285
Daily Pivot Point S21.2794
Daily Pivot Point S31.2761
Daily Pivot Point R11.2939
Daily Pivot Point R21.2972
Daily Pivot Point R31.3028

Author

Anil Panchal

Anil Panchal

FXStreet

Anil Panchal has nearly 15 years of experience in tracking financial markets. With a keen interest in macroeconomics, Anil aptly tracks global news/updates and stays well-informed about the global financial moves and their implications.

More from Anil Panchal
Share:

Editor's Picks

EUR/USD recedes to daily lows near 1.1850

EUR/USD keeps its bearish momentum well in place, slipping back to the area of 1.1850 to hit daily lows on Monday. The pair’s continuation of the leg lower comes amid decent gains in the US Dollar in a context of scarce volatility and thin trade conditions due to the inactivity in the US markets.

GBP/USD resumes the downtrend, back to the low-1.3600s

GBP/USD rapidly leaves behind Friday’s decent advance, refocusing on the downside and retreating to the 1.3630 region at the beginning of the week. In the meantime, the British Pound is expected to remain under the microscope ahead of the release of the key UK labour market report on Tuesday.

Gold looks inconclusive around $5,000

Gold partially fades Friday’s strong recovery, orbiting around the key $5,000 region per troy ounce in a context of humble gains in the Greenback on Monday. Additing to the vacillating mood, trade conditions remain thin amid the observance of the Presidents Day holiday in the US.

Bitcoin consolidates as on-chain data show mixed signals

Bitcoin price has consolidated between $65,700 and $72,000 over the past nine days, with no clear directional bias. US-listed spot ETFs recorded a $359.91 million weekly outflow, marking the fourth consecutive week of withdrawals.

The week ahead: Key inflation readings and why the AI trade could be overdone

It is likely to be a quiet start to the week, with US markets closed on Monday for Presidents Day. European markets are higher across the board and gold is clinging to the $5,000 level after the tamer than expected CPI report in the US reduced haven flows to precious metals.

XRP steadies in narrow range as fund inflows, futures interest rise

Ripple is trading in a narrow range between $1.45 (immediate support) and $1.50 (resistance) at the time of writing on Monday. The remittance token extended its recovery last week, peaking at $1.67 on Sunday from the weekly open at $1.43.