GBP/USD technical analysis: Nears 4-day old support-line amid bearish MACD
- GBP/USD stays on the back foot while nearing the four-day-old rising trend-line.
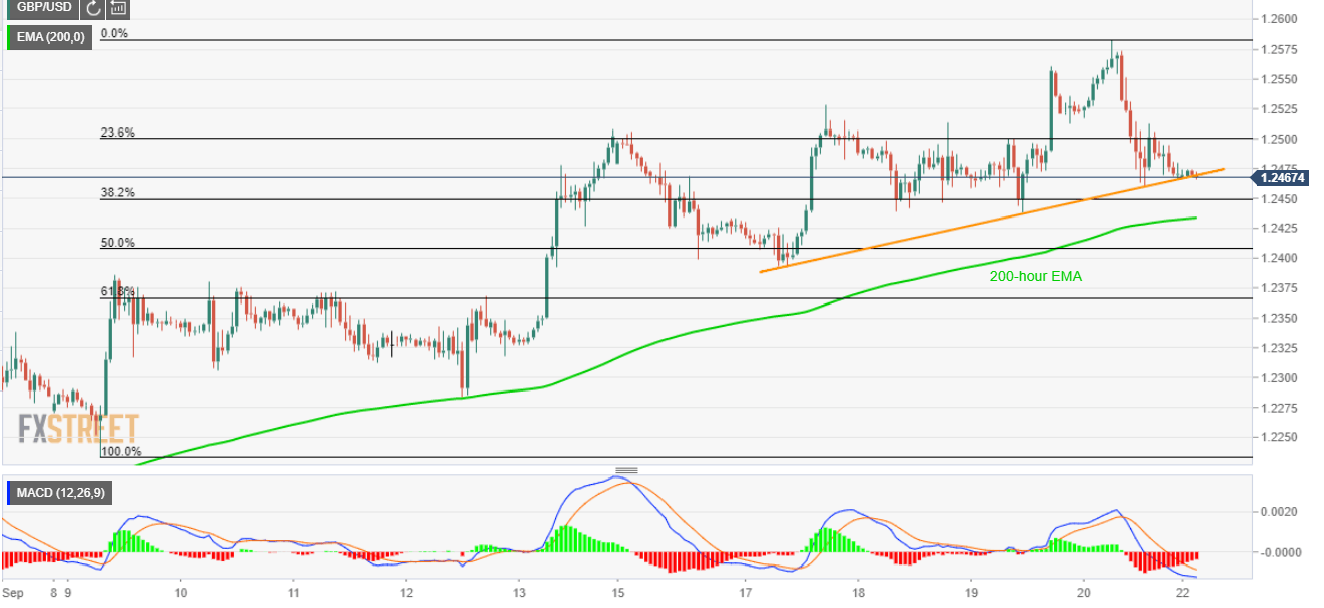
- Bearish MACD favors a decline to 200-hour EMA.

A bearish signal from the 12-bar moving average convergence and divergence (MACD) indicator portrays the GBP/USD pair’s weakness as it seesaws around near-term key support-line while taking rounds to 1.2470 during early Monday.
The pair nears a four-day-old rising trend-line level of 1.2470 with a bearish MACD signal favoring further declines to 200-hour exponential moving average (EMA) level of 1.2434.
However, 61.8% Fibonacci retracement of pair’s run-up since September 09, at 1.2367, could limit further south-run, if not then 1.2280 and 1.2230 could gain bears’ attention.
Meanwhile, 1.2500, 1.2520 and recent high surrounding 1.2585 could please buyers unless the pair portrays decisive trading below near-term key support-line.
GBP/USD hourly chart
Trend: pullback expected
Author

Anil Panchal
FXStreet
Anil Panchal has nearly 15 years of experience in tracking financial markets. With a keen interest in macroeconomics, Anil aptly tracks global news/updates and stays well-informed about the global financial moves and their implications.


