GBP/USD technical analysis: Inside falling channel below 100-HMA


  • GBP/USD struggles around 50% Fibonacci retracement of August 20-27 rise.
  • The two-day-old declining channel, price below 100-HMA portrays the momentum weakness.
  • 61.8% Fibonacci retracement, one-week long downward sloping trend-line become the key immediate supports.

GBP/USD takes the rounds to 50% Fibonacci retracement level as it flashes 1.2188 heading into Friday’s UK open.

While immediate descending trend channel’s resistance, at 1.2220, and 100-hour moving average (HMA) level of 1.2230 are likely nearby key resistances, 23.6% Fibonacci retracement level of 1.2252 can exert downside pressure to the prices.

Given the buyers’ ability to conquer 1.2252, 1.2290 and recent high surrounding 1.2310 will appear on their watch-list.

Alternatively, one-week-old downward sloping trend-line, at 1.2130 follows channel’s support of 1.2163 and 61.8% Fibonacci retracement level of 1.2158 during the pair’s pullback.

If sellers dominate past-1.2130, August 22 low near 1.2110 and 1.2065 can please the bears.

GBP/USD hourly chart
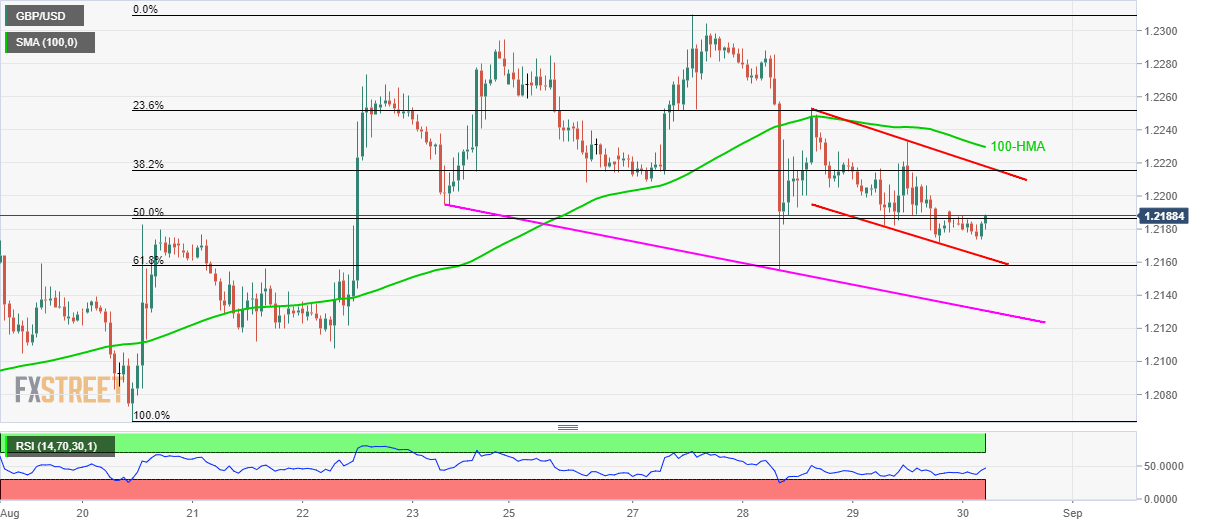
Trend: bearish

additional important levels

Overview
Today last price 1.2186
Today Daily Change 4 pips
Today Daily Change % 0.03%
Today daily open 1.2182
 
Trends
Daily SMA20 1.2153
Daily SMA50 1.2362
Daily SMA100 1.2595
Daily SMA200 1.2768
Levels
Previous Daily High 1.2233
Previous Daily Low 1.2172
Previous Weekly High 1.2294
Previous Weekly Low 1.2064
Previous Monthly High 1.2706
Previous Monthly Low 1.2119
Daily Fibonacci 38.2% 1.2195
Daily Fibonacci 61.8% 1.221
Daily Pivot Point S1 1.2158
Daily Pivot Point S2 1.2135
Daily Pivot Point S3 1.2097
Daily Pivot Point R1 1.2219
Daily Pivot Point R2 1.2257
Daily Pivot Point R3 1.228


Share: Feed news

Information on these pages contains forward-looking statements that involve risks and uncertainties. Markets and instruments profiled on this page are for informational purposes only and should not in any way come across as a recommendation to buy or sell in these assets. You should do your own thorough research before making any investment decisions. FXStreet does not in any way guarantee that this information is free from mistakes, errors, or material misstatements. It also does not guarantee that this information is of a timely nature. Investing in Open Markets involves a great deal of risk, including the loss of all or a portion of your investment, as well as emotional distress. All risks, losses and costs associated with investing, including total loss of principal, are your responsibility. The views and opinions expressed in this article are those of the authors and do not necessarily reflect the official policy or position of FXStreet nor its advertisers. The author will not be held responsible for information that is found at the end of links posted on this page.

If not otherwise explicitly mentioned in the body of the article, at the time of writing, the author has no position in any stock mentioned in this article and no business relationship with any company mentioned. The author has not received compensation for writing this article, other than from FXStreet.

FXStreet and the author do not provide personalized recommendations. The author makes no representations as to the accuracy, completeness, or suitability of this information. FXStreet and the author will not be liable for any errors, omissions or any losses, injuries or damages arising from this information and its display or use. Errors and omissions excepted.

The author and FXStreet are not registered investment advisors and nothing in this article is intended to be investment advice.

Recommended content


Recommended content

Editors’ Picks

AUD/USD eases toward 0.6500 after mixed Australian trade data

AUD/USD eases toward 0.6500 after mixed Australian trade data

AUD/USD is seeing some fresh selling interest in the Asian session on Thursday, following the release of mixed Australian trade data. The pair has stalled its recovery mode, as the US Dollar attempts a bounce after the Fed-led sell-off.   

AUD/USD News

USD/JPY holds rebound near 156.00 after probable Japan's intervention-led crash

USD/JPY holds rebound near 156.00 after probable Japan's intervention-led crash

USD/JPY consolidates the rebound near 156.00, having lost nearly 450 pips in some minutes after the Japanese Yen rallied hard on another suspected Japan FX market intervention in the late American session on Wednesday. 

USD/JPY News

Gold price struggles for a firm intraday direction, hover above $2,300

Gold price struggles for a firm intraday direction, hover above $2,300

Gold price fails to lure buyers amid a fresh leg up in the US bond yields, modest USD uptick. A positive risk tone also contributes to capping the upside for the safe-haven precious metal. Traders, however, might prefer to wait for the US NFP report before placing aggressive bets.

Gold News

Top 3 Price Prediction BTC, ETH, XRP: Altcoins to pump once BTC bottoms out, slow grind up for now

Top 3 Price Prediction BTC, ETH, XRP: Altcoins to pump once BTC bottoms out, slow grind up for now

Bitcoin reclaiming above $59,200 would hint that BTC has already bottomed out, setting the tone for a run north. Ethereum holding above $2,900 keeps a bullish reversal pattern viable despite falling momentum. Ripple coils up for a move north as XRP bulls defend $0.5000.

Read more

The FOMC whipsaw and more Yen intervention in focus

The FOMC whipsaw and more Yen intervention in focus

Market participants clung to every word uttered by Chair Powell as risk assets whipped around in a frenetic fashion during the afternoon US trading session.

Read more

Forex MAJORS

Cryptocurrencies

Signatures