GBP/USD technical analysis: Choppy between 1.2525, 23.6% Fibo.
- RSI recovers from oversold conditions indicating price pullback on the upside.
- 1.2480/77 holds the key to fresh south-run.

With the British Pound (GBP) buyers waiting for the monthly employment data, GBP/USD clings to 1.2515 ahead of the UK open on Tuesday.
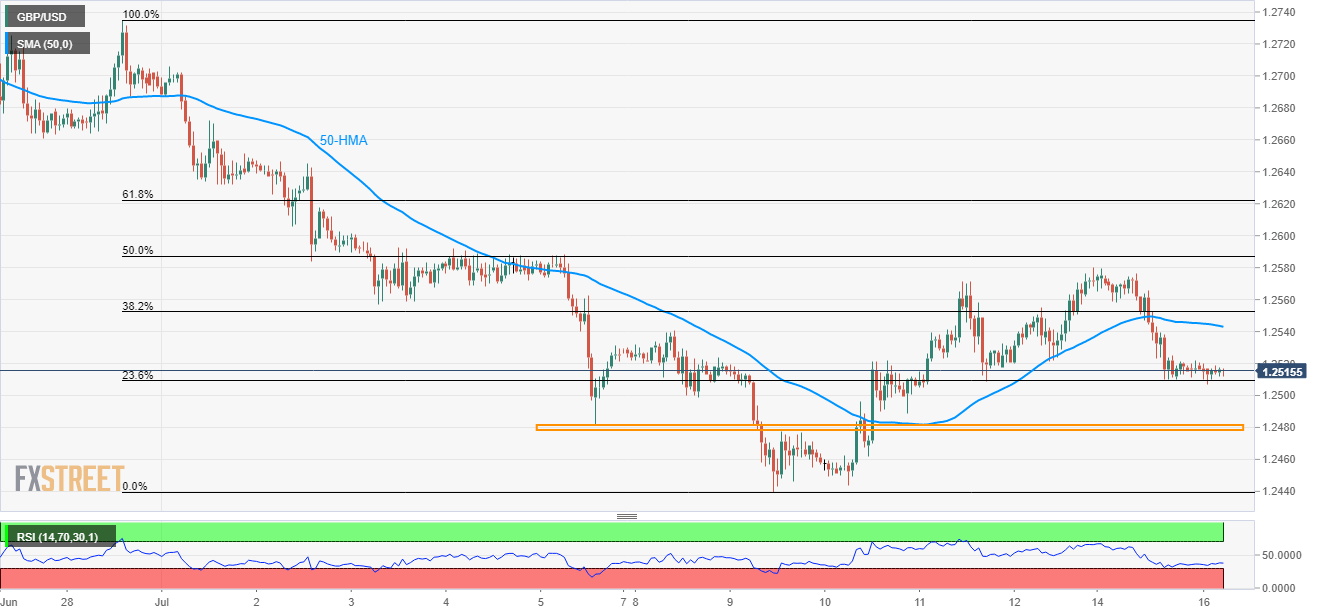
The pair has been choppy between 23.6% Fibonacci retracement of late-June to early month declines, at 1.2510 and 1.2525 off-late. However, recovery of 14-bar relative strength index (RSI) from oversold conditions favor the pair’s upside more than otherwise.
In doing so, the 50-hour moving average (50-HMA) level of 1.2545 can offer an intermediate halt to the rally towards monthly top surrounding 1.2580.
Alternatively, the pair’s break of 1.2510 highlights the importance of 1.2480/77 horizontal support area that holds the key to the downpour in the direction to 1.2440, 1.2430 and the 1.2400 round-figure.
GBP/USD hourly chart
Trend: Sideways
Author

Anil Panchal
FXStreet
Anil Panchal has nearly 15 years of experience in tracking financial markets. With a keen interest in macroeconomics, Anil aptly tracks global news/updates and stays well-informed about the global financial moves and their implications.


