GBP/USD technical analysis: 200-hour EMA adds strength to immediate triangle support
- GBP/USD forms a symmetrical triangle pattern on the hourly chart.
- 200-hour EMA strengthens the support, limiting the downside to 38.2% Fibonacci retracement.
GBP/USD has mostly been in a small trading range portrayed by a four-day-old symmetrical triangle. The quote currently heads to formation resistance while taking rounds to 1.2350 before the UK session starts on Friday.
While an area including July 17 low and current week high around 1.2380/85 is likely to limit pair’s upside past-1.2365 triangle resistance, pair’s further rise could well target 100-day exponential moving average (EMA) level of 1.2470.
Alternatively, pair’s pullback, as most expected, could avail a halt around 1.2315 during its declines to the pattern support around 1.2290 that also includes 200-hour EMA.
If at all sellers manage to conquer 1.2290 support-mark, 38.2% Fibonacci retracement of current-month upside, at 1.2220, and September 02 high near 1.2170 could lure sellers.
GBP/USD hourly chart
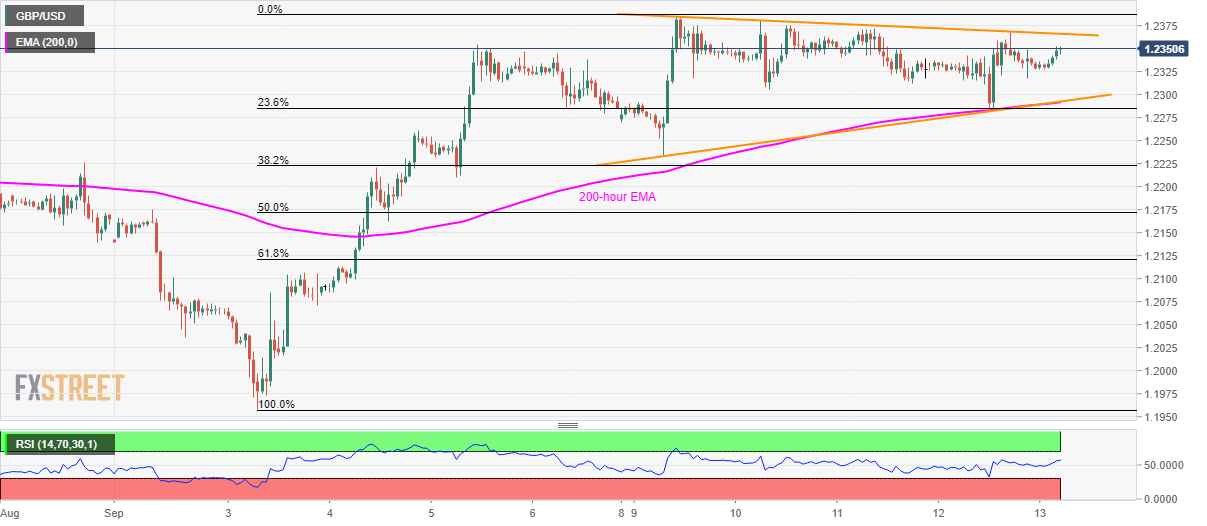
Trend: sideways
Author

Anil Panchal
FXStreet
Anil Panchal has nearly 15 years of experience in tracking financial markets. With a keen interest in macroeconomics, Anil aptly tracks global news/updates and stays well-informed about the global financial moves and their implications.


