|

GBP/USD surges amidst US labor market data, BoE rate hike bets

  • GBP/USD skyrockets as US Jobless Claims soar; investors expect Fed pause.
  • US Treasury bond yields pressured, USD Index collapsed by 0.73%.
  • BoE anticipated rate hike cushions GBP amid sparse economic data.

GBP/USD rallies above 1.2500 as labor market data from the United States (US) keeps investors expecting a pause on the Federal Reserve (Fed) hiking cycle. The lack of economic data to be revealed in the UK, alongside traders betting for Bank of England’s (BoE) additional tightening, underpins the GBP/USD. The GBP/USD trades at 1.2550 after hitting a low of 1.2429.

Sterling rally overrides US Dollar amid US jobless claims spike, Fed’s rate hike pause

The GBP/USD advances aggressively following last week’s Initial Jobless Claims report. The US Department of Labor revealed an increase of 261K unemployment claims, above estimates of 232K, the highest record since October 2021. Continuing Claims dropped 37K to 1.757M in the week ending May 27. The report justifies the Fed’s view of skipping an interest rate increase in June, though next week’s inflation report could shift expectations one day before the decision.

In the fixed-income sphere, US Treasury bond yields are under pressure, with 2s and 10s losing four and eight basis points, respectively, at 4.515%, and 3.716%, a headwind for the greenback. The US Dollar Index, which measures the performance of a basket of six currencies vs. the buck, collapses by 0.73%, at 103.345.

Across the pond, estimates that the Bank of England will continue to lift rates cushioned Pound Sterling (GBP) fall at the beginning of the week. Money market futures estimate the BoE will hike 100 bps towards the year-end. That means the Bank Rate will hit 5.50%.

Upcoming events.

Friday’s economic calendar is absent for both countries, but the next week, it will pick up some steam. On Tuesday, the UK will update the labor market status. Meanwhile, the US Consumer Price Index (CPI) will shed some light and could view by Fed officials, who begin the monetary policy meeting on the same day.

GBP/USD Price Analysis: Technical outlook

GBP/USD Daily chart

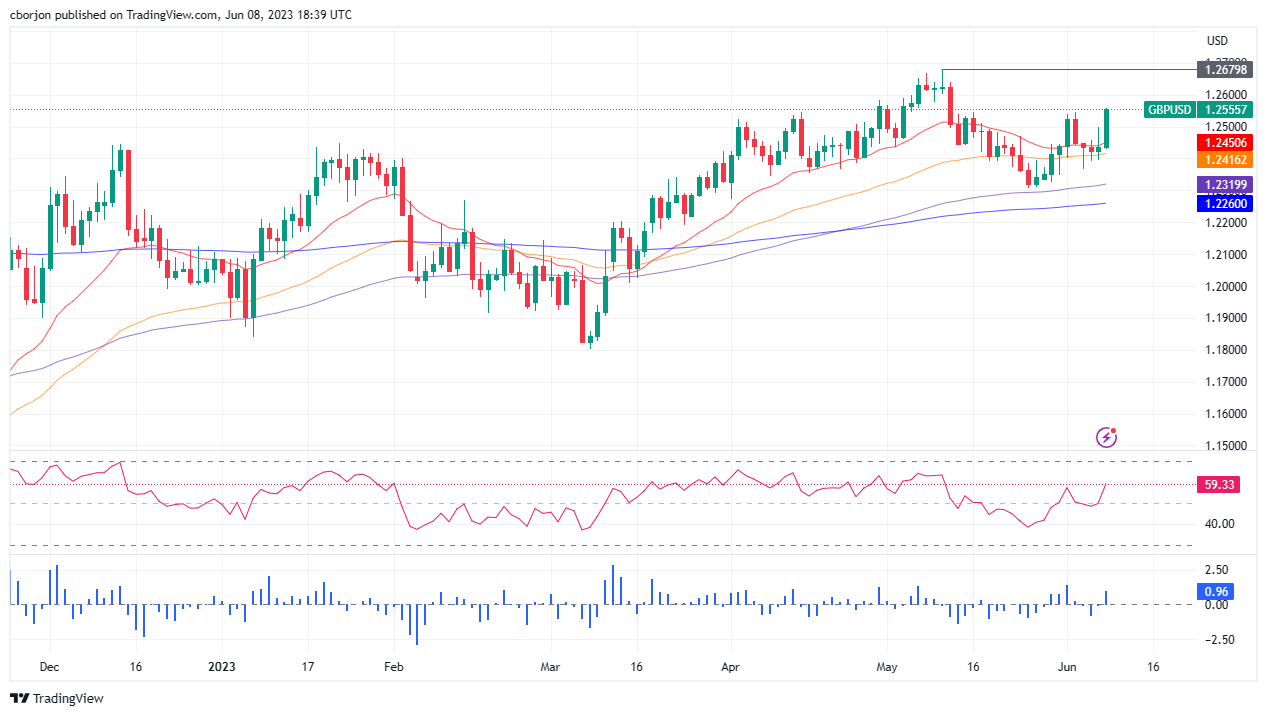
The GBP/USD recovered from its losses and advanced comfortably above 1.2500, with buyers eyeing year-to-date (YTD) highs at around 1.2679. Technical indicators cement the case for an uptrend, with the Relative Strength Index (RSI) reaching new peaks, while the three-day Rate of Change (RoC) depicts buyers gathering momentum. Upside risks lie at the 1.2600 figure, followed by the YTD high, ahead of the 1.2700 mark. On the flip side, the June 7 high-turned support at 1.2499 is the first support, immediately followed by the 20-day Exponential Moving Average (EMA) at 1.2450 before diving to the 50-day EMA at 1.2416.

GBP/USD

Overview
Today last price1.2556
Today Daily Change0.0119
Today Daily Change %0.96
Today daily open1.2437
 
Trends
Daily SMA201.2434
Daily SMA501.246
Daily SMA1001.2305
Daily SMA2001.2006
 
Levels
Previous Daily High1.25
Previous Daily Low1.2395
Previous Weekly High1.2545
Previous Weekly Low1.2327
Previous Monthly High1.268
Previous Monthly Low1.2308
Daily Fibonacci 38.2%1.246
Daily Fibonacci 61.8%1.2435
Daily Pivot Point S11.2388
Daily Pivot Point S21.2339
Daily Pivot Point S31.2283
Daily Pivot Point R11.2493
Daily Pivot Point R21.2549
Daily Pivot Point R31.2598

Author

Christian Borjon Valencia

Christian Borjon began his career as a retail trader in 2010, mainly focused on technical analysis and strategies around it. He started as a swing trader, as he used to work in another industry unrelated to the financial markets.

More from Christian Borjon Valencia
Share:

Markets move fast. We move first.

Orange Juice Newsletter brings you expert driven insights - not headlines. Every day on your inbox.

By subscribing you agree to our Terms and conditions.

Editor's Picks

EUR/USD: Bulls pray for a dovish Fed

EUR/USD has finally taken a breather after a pretty energetic climb. The pair broke above 1.1680 in the second half of the week, reaching its highest levels in around two months before running into some selling pressure. Even so, it has gained almost two cents from the late-November dip just below 1.1500 the figure.

GBP/USD trims gains, recedes toward 1.3320

GBP/USD is struggling to keep its daily advance, coming under fresh pressure and retreating to the 1.3320 zone following a mild bullish attempt in the Greenback. Even though US consumer sentiment surprised to the upside, the US Dollar isn’t getting much love, as traders are far more interested in what the Fed will say next week.

Gold: Bullish momentum fades despite broad USD weakness

After rising more than 3.5% in the previous week, Gold has entered a consolidation phase and fluctuated at around $4,200. The Federal Reserve’s interest rate decision and revised Summary of Economic Projections, also known as the dot plot, could trigger the next directional move in XAU/USD. 

Week ahead: Rate cut or market shock? The Fed decides

Fed rate cut widely expected; dot plot and overall meeting rhetoric also matter. Risk appetite is supported by Fed rate cut expectations; cryptos show signs of life. RBA, BoC and SNB also meet; chances of surprises are relatively low. Dollar weakness could linger; both the aussie and the yen best positioned to gain further. Gold and oil eye Ukraine-Russia developments; a peace deal remains elusive.

Week ahead – Rate cut or market shock? The Fed decides

Fed rate cut widely expected; dot plot and overall meeting rhetoric also matter. Risk appetite is supported by Fed rate cut expectations; cryptos show signs of life. RBA, BoC and SNB also meet; chances of surprises are relatively low.

Ripple faces persistent bear risks, shrugging off ETF inflows

Ripple is extending its decline for the second consecutive day, trading at $2.06 at the time of writing on Friday. Sentiment surrounding the cross-border remittance token continues to lag despite steady inflows into XRP spot ETFs.