|

GBP/USD struggling to find gains above 1.2400 despite broad-market risk-on bids

  • The GBP/USD is trading flat but rough on Friday, trying to hold above the 1.2400 handle.
  • The Pound Sterling's midweek rally is still under threat as markets pare away gains.
  • Slumping UK data is sending the GBP into consolidation.

The GBP/USD is treading water just above the 1.2400 handle as the pair grapples with the top end of recent consolidation. The Pound Sterling (GBP) is struggling to hold onto gains chalked in against the US Dollar (USD) this week.

The GBP peaked at a 2.25% gain against the US Dollar in the mid-week, and has since eased back to a more reasonable 1.65%.

Despite a broad-market risk bid fueled by the markets once again speculating that the Federal Reserve (Fed) is done with interest rate hikes, the GBP/USD is remaining trapped in the midrange as UK data misses the mark.

UK Retail Sales decline 0.3% MoM in October

UK Retail Sales declined month-on-month, with the October figure printing at -0.3%, reversing course on the market's forecast 0.3% increase. Losses on the tail end were the focus for investors however, with September's figure getting revised even lower from -0.9% to an eye-watering -1.1%.

Annualized UK Retail Sales fared even worse, with the year into October printing at -2.7% against the previous -1%, and accelerating past the forecast -1.5%.

Next week will see investors turning their attention towards the Fed's latest Meeting Minutes release on Tuesday.

GBP/USD Technical Outlook

The GBP/USD is in the green for the week, up 1.65% as the Pound Sterling holds onto what's left of the mid-week gains.

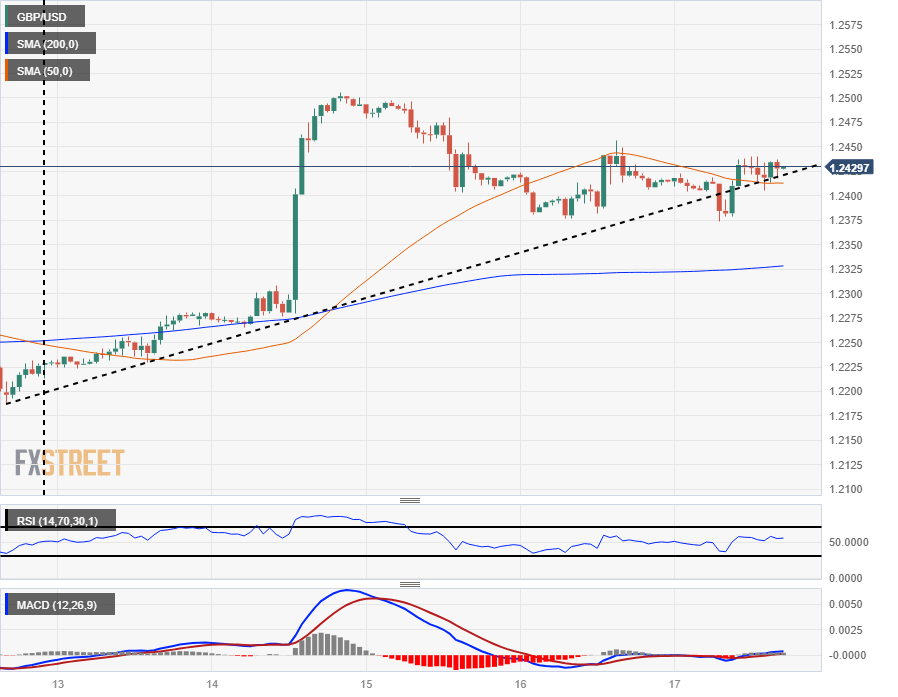
A near-term rising trendline from last week's lows near 1.2200 is still holding intraday action on the top side as hourly candles grapple with the 50-hour Simple Moving Average (SMA), but a flattening 200-hour SMA is set to continue drawing bids back into the median range.

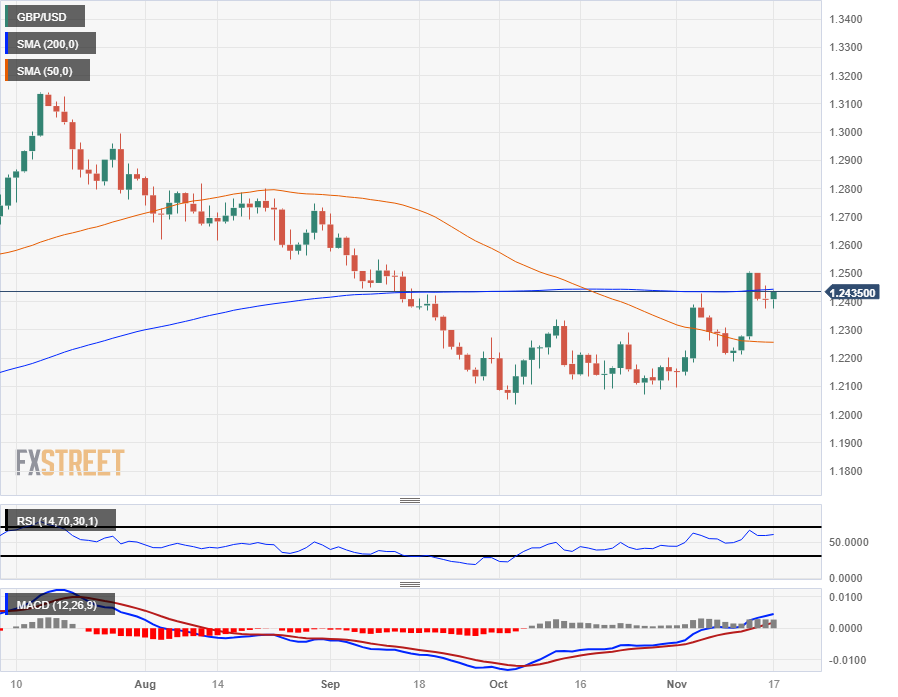
Daily candlesticks have the GBP/USD strung up on the 200-day SMA as the pair struggles to develop fresh long-term momentum, and this week's peak at the 1.2500 handle represents the key figure for bullls to beat.

GBP/USD Hourly Chart

GBP/USD Daily Chart

GBP/USD Technical Levels

GBP/USD

Overview
Today last price1.2428
Today Daily Change0.0019
Today Daily Change %0.15
Today daily open1.2409
 
Trends
Daily SMA201.2248
Daily SMA501.2257
Daily SMA1001.2511
Daily SMA2001.2442
 
Levels
Previous Daily High1.2456
Previous Daily Low1.2376
Previous Weekly High1.2429
Previous Weekly Low1.2187
Previous Monthly High1.2337
Previous Monthly Low1.2037
Daily Fibonacci 38.2%1.2407
Daily Fibonacci 61.8%1.2426
Daily Pivot Point S11.2372
Daily Pivot Point S21.2334
Daily Pivot Point S31.2292
Daily Pivot Point R11.2451
Daily Pivot Point R21.2493
Daily Pivot Point R31.2531

Author

Joshua Gibson

Joshua joins the FXStreet team as an Economics and Finance double major from Vancouver Island University with twelve years' experience as an independent trader focusing on technical analysis.

More from Joshua Gibson
Share:

Editor's Picks

EUR/USD looks to regain the 200-day SMA

EUR/USD regains some balance and trade just above 1.1600 the figure ahead of the opening bell in Asia. The pair initially dipped to the 1.1530 zone for the first time since November, always following the stronger US Dollar and the marked flight-to-safety in the context of the ongoing Middle East crisis
 

GBP/USD attacks 1.3300, refreshing three-month lows

GBP/USD is deep in the red near 1.3300, accelerating its downside to renew three-month lows in European trading on Tuesday. The ongoing escalation in the Iran war, combined with rising Oil prices, weighs negatively on the higher-yielding Pound Sterling as the US Dollar capitalizes on increased haven demand.

Gold bounces off lows, back above $5,100

Gold remains on the defensive, eroding part of the recent multi-day advance and managing to trade back above the $5,100 mark per troy ounce on Tuesday. The precious metal initially dropped just below the critical $5,000 threshold on the back of the persistent strength of the Greenback, higher US Treasury yields across the curve and investors' repricing of Fed rate cuts.

XRP risks extending losses as US-Iran war rages on

Ripple (XRP) has come under pressure, drifting lower to $1.35 at the time of writing on Tuesday. The over 2% correction looks poised to erase the previous day’s gains, which lifted the remittance token to $1.42.

Energy shock 2.0: Why rising Gas prices could hit the Euro

Even without a confirmed, sustained disruption, the mere risk to a key global energy chokepoint is enough to inject a significant premium into European Gas markets. And for the Euro, that matters.

Ripple falters amid sell-off jitters and negative funding rates

Ripple (XRP) has come under pressure, drifting lower to $1.35 at the time of writing on Tuesday. The over 2% correction looks poised to erase the previous day’s gains, which lifted the remittance token to $1.42.