- GBP/USD bounces off ascending channel support, clears 1.3000, and reaches a high of 1.3039 after the UK’s autumn budget release.
- Buyers must clear October 18 peak at 1.3070 to test 1.3100 and the 50-day SMA at 1.3138.
- Key support lies at the October 29 close of 1.3014 and the 100-day SMA at 1.2974, followed by the October low of 1.2936.
The Pound Sterling erased some of its earlier losses, climbing above its opening price against the US Dollar, after the UK Chancellor Rachel Reeves revealed its autumn budget. The GBP/USD trades above 1.3000, virtually unchanged.
According to the Financial Times, the Autumn budget was well received by the markets. Gilt yields are falling, and Cable aimed higher after the new labor Government announced its first budget in 14 years.
GBP/USD Price Forecast: Technical outlook
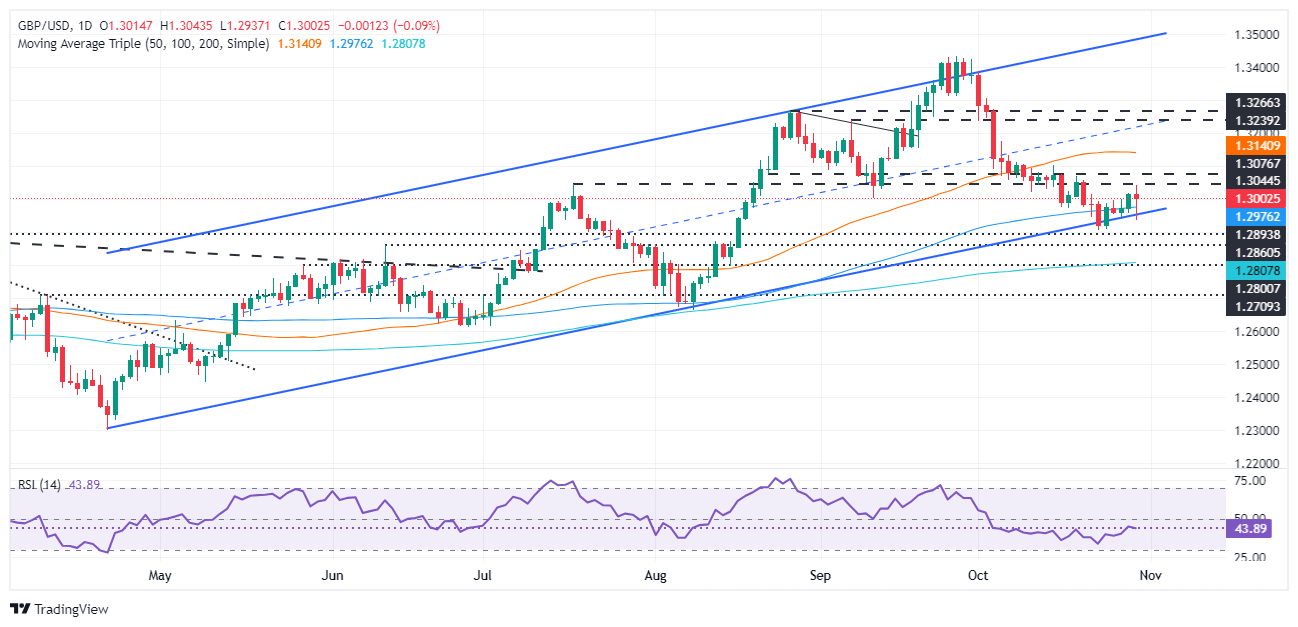
The GBP/USD bounced at the bottom of an ascending channel trendline, extending its gains after Chancellor Reeves, ended her speech. Initially, the pair cleared 1.2970, and pushed higher, clearing the 1.3000 figure hitting a high of 1.3039.
From a technical standpoint, the GPB/USD is not out of the woods, as sellers continued to cap the pair’s advance. Buyers must clear October 18 peak at 1.3070, so they could remain hopeful of testing 1.3100. Once those key resistance levels are taken out, the 50-day Simple Moving Average (SMA) would be up next at 1.3138.
Otherwise, if sellers push the exchange rate below the October 29 daily close of 1.3014, it would expose the 1.3000 psychological level as the next support. A breach of the latter will expose the 100-day SMA at 1.2974, before the GBP/USD tumbles towards October 300 low of 1.2936.
GBP/USD Price Chart – Daily
British Pound PRICE Today
The table below shows the percentage change of British Pound (GBP) against listed major currencies today. British Pound was the strongest against the Canadian Dollar.
USD | EUR | GBP | JPY | CAD | AUD | NZD | CHF | |
---|---|---|---|---|---|---|---|---|
USD | -0.34% | 0.10% | -0.11% | 0.05% | -0.30% | -0.09% | -0.14% | |
EUR | 0.34% | 0.44% | 0.23% | 0.39% | 0.03% | 0.24% | 0.20% | |
GBP | -0.10% | -0.44% | -0.20% | -0.05% | -0.41% | -0.20% | -0.22% | |
JPY | 0.11% | -0.23% | 0.20% | 0.14% | -0.21% | -0.01% | -0.04% | |
CAD | -0.05% | -0.39% | 0.05% | -0.14% | -0.36% | -0.15% | -0.17% | |
AUD | 0.30% | -0.03% | 0.41% | 0.21% | 0.36% | 0.21% | 0.18% | |
NZD | 0.09% | -0.24% | 0.20% | 0.01% | 0.15% | -0.21% | -0.03% | |
CHF | 0.14% | -0.20% | 0.22% | 0.04% | 0.17% | -0.18% | 0.03% |
The heat map shows percentage changes of major currencies against each other. The base currency is picked from the left column, while the quote currency is picked from the top row. For example, if you pick the British Pound from the left column and move along the horizontal line to the US Dollar, the percentage change displayed in the box will represent GBP (base)/USD (quote).
Information on these pages contains forward-looking statements that involve risks and uncertainties. Markets and instruments profiled on this page are for informational purposes only and should not in any way come across as a recommendation to buy or sell in these assets. You should do your own thorough research before making any investment decisions. FXStreet does not in any way guarantee that this information is free from mistakes, errors, or material misstatements. It also does not guarantee that this information is of a timely nature. Investing in Open Markets involves a great deal of risk, including the loss of all or a portion of your investment, as well as emotional distress. All risks, losses and costs associated with investing, including total loss of principal, are your responsibility. The views and opinions expressed in this article are those of the authors and do not necessarily reflect the official policy or position of FXStreet nor its advertisers. The author will not be held responsible for information that is found at the end of links posted on this page.
If not otherwise explicitly mentioned in the body of the article, at the time of writing, the author has no position in any stock mentioned in this article and no business relationship with any company mentioned. The author has not received compensation for writing this article, other than from FXStreet.
FXStreet and the author do not provide personalized recommendations. The author makes no representations as to the accuracy, completeness, or suitability of this information. FXStreet and the author will not be liable for any errors, omissions or any losses, injuries or damages arising from this information and its display or use. Errors and omissions excepted.
The author and FXStreet are not registered investment advisors and nothing in this article is intended to be investment advice.
Recommended content
Editors’ Picks

EUR/USD turns lower toward 1.1300 as US Dollar demand picks up
EUR/USD has come under renewed selling pressure and heads back toward 1.1300 n Monday’s European session. The upbeat market mood and a fresh US Dollar uptick undermines the pair amid a quiet start to a critical week ahead.

GBP/USD drops back below 1.3300 on US Dollar strength
GBP/USD returns to the red below 1.3300 in the European trading hours on Monday. Sustained US Dollar strength and easing trade tensions weigh negatively on the pair. Meanwhile, the technical outlook on the daily chart suggests a weakening bullish trend.

Gold price remains depressed below $3,300 amid signs of easing US-China trade tensions
Gold price maintains its offered tone through the Asian session on Monday and currently trades below the $3,300 round-figure mark, down 0.75% for the day. Despite mixed signals from the US and China, investors remain hopeful over the potential de-escalation of tensions between the world's two largest economies.

Bitcoin and Ethereum stabilize while Ripple shows strength
Bitcoin and Ethereum prices are stabilizing at around $93,500 and $1,770 at the time of writing on Monday, following a rally of over 10% and 12% the previous week. Ripple price also rallied 8.3% and closed above its key resistance level last week, indicating an uptrend ahead.

Week ahead: US GDP, inflation and jobs in focus amid tariff mess – BoJ meets
Barrage of US data to shed light on US economy as tariff war heats up. GDP, PCE inflation and nonfarm payrolls reports to headline the week. Bank of Japan to hold rates but may downgrade growth outlook. Eurozone and Australian CPI also on the agenda, Canadians go to the polls.

The Best brokers to trade EUR/USD
SPONSORED Discover the top brokers for trading EUR/USD in 2025. Our list features brokers with competitive spreads, fast execution, and powerful platforms. Whether you're a beginner or an expert, find the right partner to navigate the dynamic Forex market.