- GBP/USD slips towards key support at 1.3044, with momentum favoring further downside in the short term.
- RSI is turning bearish, signaling potential losses, with next support at 1.3000 and the 50-DMA at 1.2940.
- For buyers to regain control, GBP/USD must clear resistance at 1.3143 and push towards 1.3200.
The GBP/USD is on the backfoot after spiking to a daily high of 1.3107 after a solid UK jobs report, though it has retreated below the 1.31 handle as traders await the release of US inflation data. At the time of writing, the pair trades at 1.3052, down 0.17%
GBP/USD Price Forecast: Technical outlook
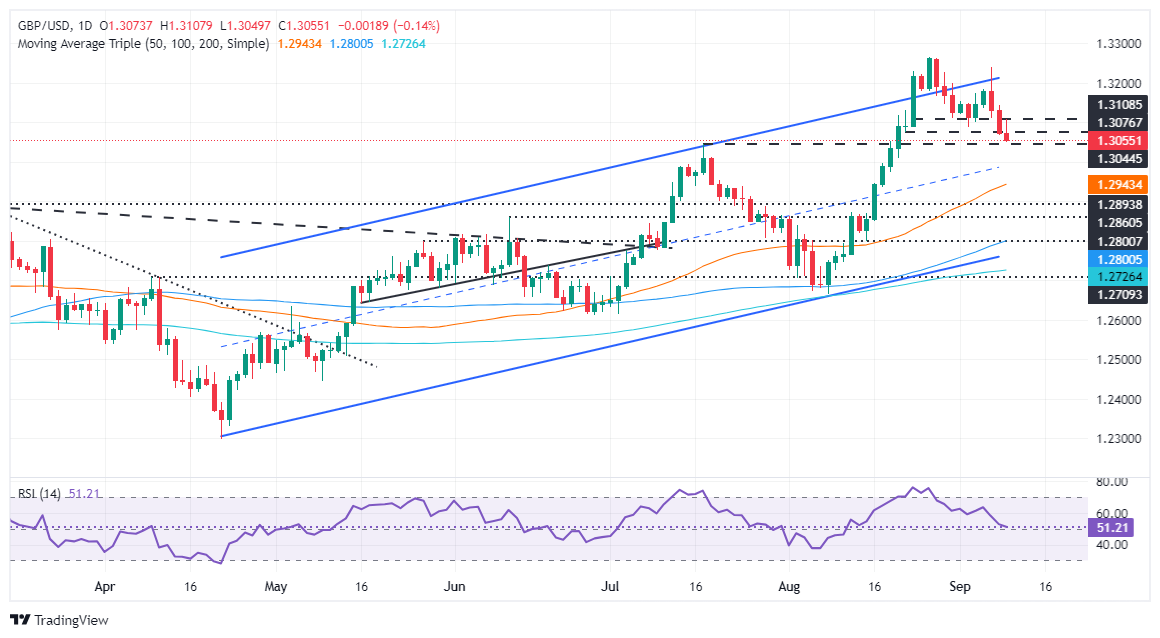
The GBP/USD fall toward the July 17 peak at 1.3044 could exert downward pressure on the pair and pave the way for further losses.
Momentum favors sellers in the short term. The Relative Strength Index (RSI) remains bullish, though its slope is aiming down and about to turn bearish, which could accelerate Sterling’s fall against the Greenback.
In that scenario, the GBP/USD path of least resistance is tilted to the downside. The first support would be 1.3044, followed by the psychological figure of 1.3000. A breach or the latter will expose the 50-day moving average (DMA) at 1.2940, ahead of the 1.2900 mark.
Conversely, if buyers would like to regain control, they must clear the September 9 high at 1.3143 before having the chance of challenging the 1.3200 figure.
GBP/USD Price Action – Daily Chart
British Pound PRICE Today
The table below shows the percentage change of British Pound (GBP) against listed major currencies today. British Pound was the strongest against the Canadian Dollar.
USD | EUR | GBP | JPY | CAD | AUD | NZD | CHF | |
---|---|---|---|---|---|---|---|---|
USD | 0.14% | 0.14% | -0.40% | 0.35% | 0.24% | -0.03% | -0.23% | |
EUR | -0.14% | 0.00% | -0.52% | 0.20% | 0.09% | -0.22% | -0.38% | |
GBP | -0.14% | 0.00% | -0.52% | 0.17% | 0.11% | -0.21% | -0.36% | |
JPY | 0.40% | 0.52% | 0.52% | 0.71% | 0.62% | 0.32% | 0.15% | |
CAD | -0.35% | -0.20% | -0.17% | -0.71% | -0.12% | -0.38% | -0.56% | |
AUD | -0.24% | -0.09% | -0.11% | -0.62% | 0.12% | -0.29% | -0.46% | |
NZD | 0.03% | 0.22% | 0.21% | -0.32% | 0.38% | 0.29% | -0.17% | |
CHF | 0.23% | 0.38% | 0.36% | -0.15% | 0.56% | 0.46% | 0.17% |
The heat map shows percentage changes of major currencies against each other. The base currency is picked from the left column, while the quote currency is picked from the top row. For example, if you pick the British Pound from the left column and move along the horizontal line to the US Dollar, the percentage change displayed in the box will represent GBP (base)/USD (quote).
Information on these pages contains forward-looking statements that involve risks and uncertainties. Markets and instruments profiled on this page are for informational purposes only and should not in any way come across as a recommendation to buy or sell in these assets. You should do your own thorough research before making any investment decisions. FXStreet does not in any way guarantee that this information is free from mistakes, errors, or material misstatements. It also does not guarantee that this information is of a timely nature. Investing in Open Markets involves a great deal of risk, including the loss of all or a portion of your investment, as well as emotional distress. All risks, losses and costs associated with investing, including total loss of principal, are your responsibility. The views and opinions expressed in this article are those of the authors and do not necessarily reflect the official policy or position of FXStreet nor its advertisers. The author will not be held responsible for information that is found at the end of links posted on this page.
If not otherwise explicitly mentioned in the body of the article, at the time of writing, the author has no position in any stock mentioned in this article and no business relationship with any company mentioned. The author has not received compensation for writing this article, other than from FXStreet.
FXStreet and the author do not provide personalized recommendations. The author makes no representations as to the accuracy, completeness, or suitability of this information. FXStreet and the author will not be liable for any errors, omissions or any losses, injuries or damages arising from this information and its display or use. Errors and omissions excepted.
The author and FXStreet are not registered investment advisors and nothing in this article is intended to be investment advice.
Recommended content
Editors’ Picks

AUD/USD weighed down by China, tariffs
AUD/USD remained on the back foot, slipping back to the area of multi-year lows around 0.5950 on the back of mounting fears surrounding tariffs and their impact on the Chinese economy.

EUR/USD refocuses on 1.1000 amid tariffs jitters
EUR/USD reversed two daily pullbacks in a row an d managed to advance to the boundaries of the 1.1000 barrier on the back of fresh weakness hurting the US Dollar and persistent tariff fears.

Gold erases gains, back to the $2,980 zone
Gold prices now lose extra ground and slip back to the area of daily troughs near $2,980 mark per troy ounce following an unsuccesful attempt to maintain the trade above the critical $3,000 level earlier in the day.

XRP drops 3% as Ripple announces $1.25 billion acquisition of prime brokerage firm Hidden Road
Ripple announced on Tuesday that it is acquiring prime brokerage firm Hidden Road to enhance its institutional offerings and increase the adoption of the RLUSD stablecoin and the XRP Ledger (XRPL).

The Fed is looking at a hefty price level
We are still in thrall to tariffs, the faux-macro “data” driving markets. The WSJ editorial board advised other countries to take their tariffs to zero so that Trump’s “reciprocal” tariffs will have to be zero, too. Cute, but no cigar.

The Best brokers to trade EUR/USD
SPONSORED Discover the top brokers for trading EUR/USD in 2025. Our list features brokers with competitive spreads, fast execution, and powerful platforms. Whether you're a beginner or an expert, find the right partner to navigate the dynamic Forex market.