GBP/USD Price Forecast: Remains confined in a range below 1.3100 ahead of UK CPI
- GBP/USD remains confined in a familiar range held over the past week or so.
- Traders opt to wait on the sidelines ahead of the release of the UK CPI report.
- The technical setup favors bears and supports prospects for further losses.

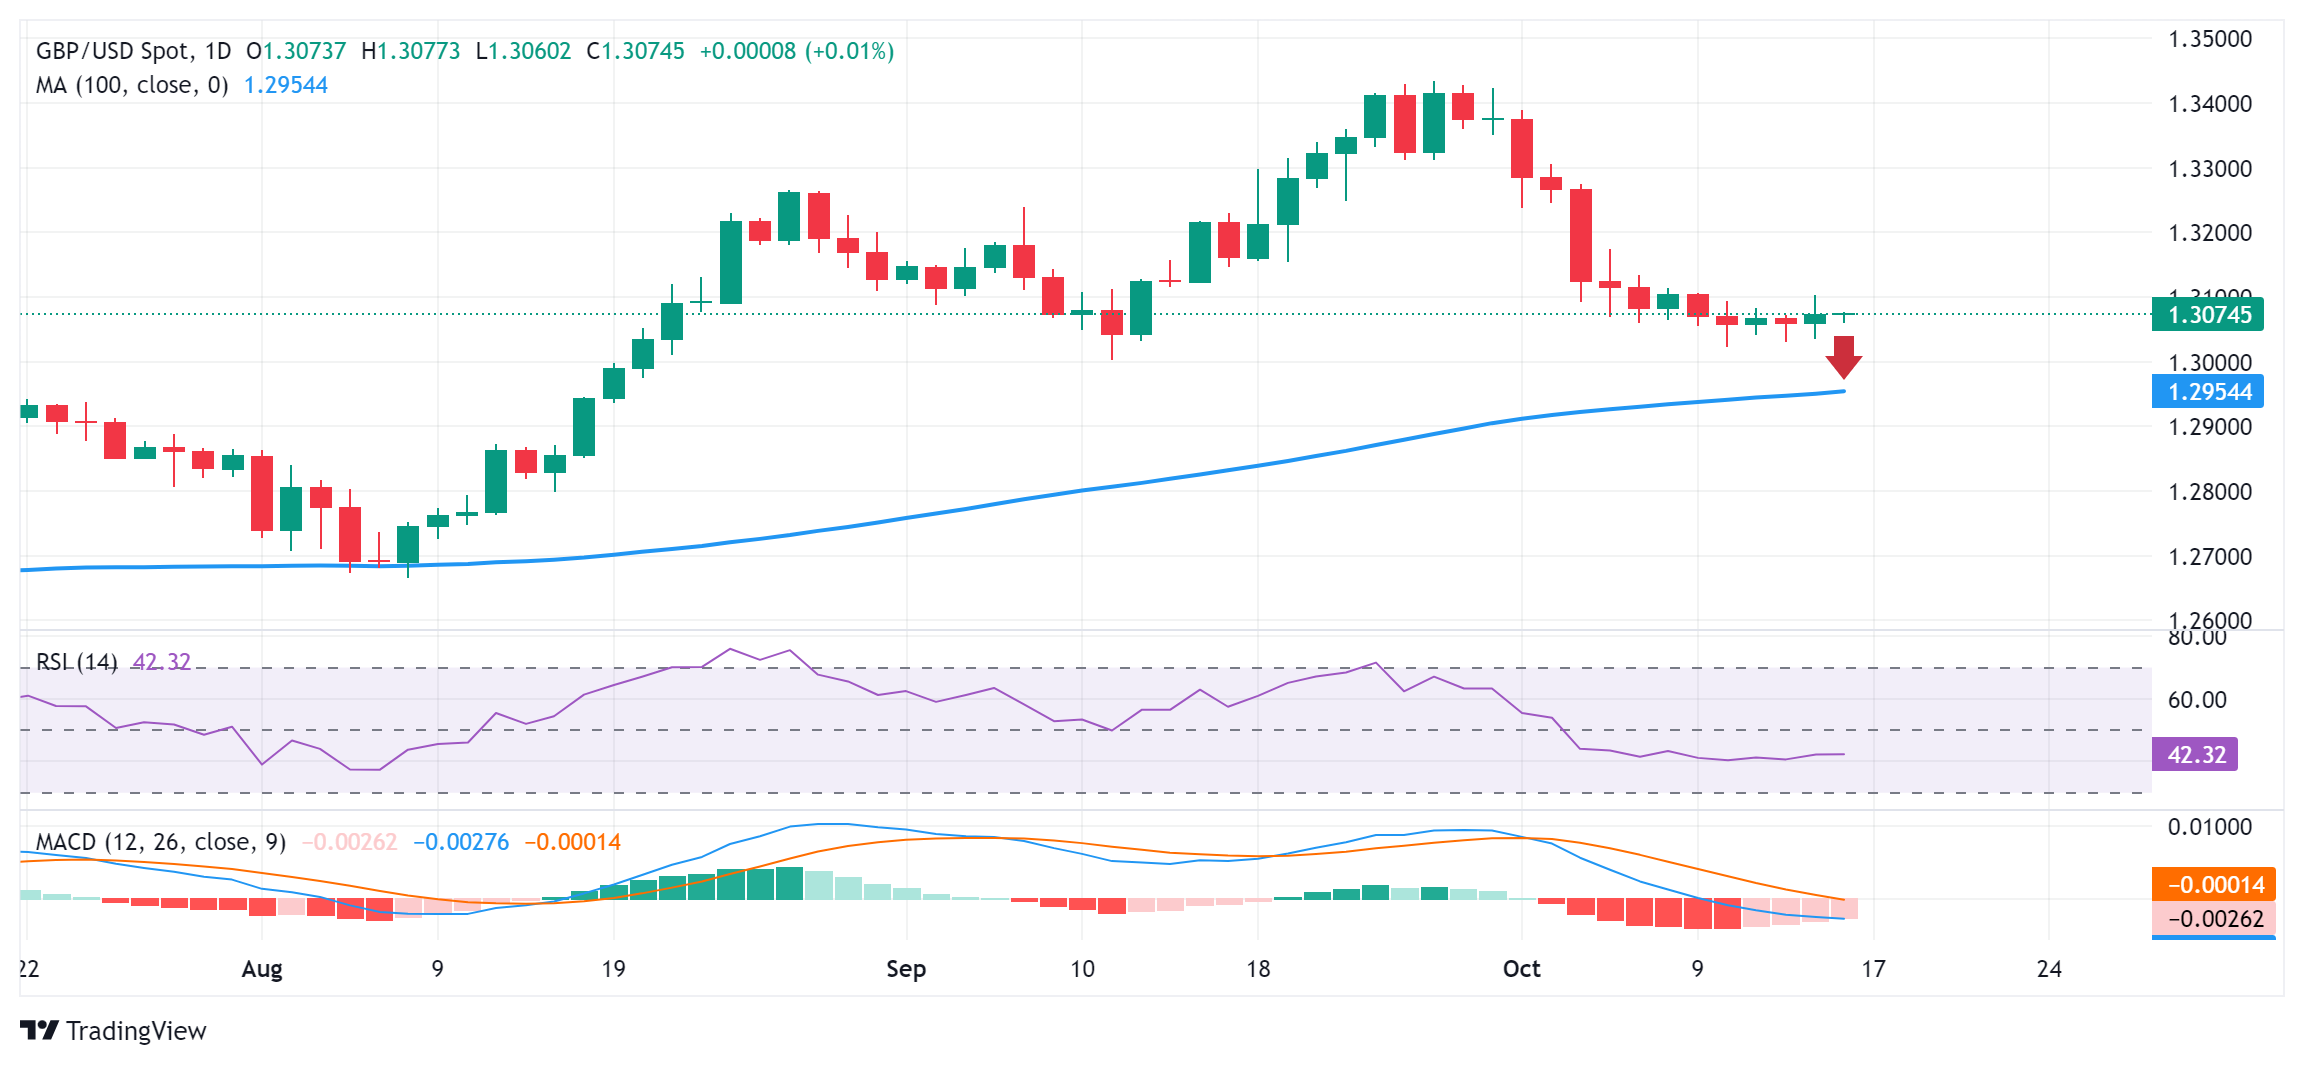
The GBP/USD pair extends its sideways consolidative price move on Wednesday and remains confined in a familiar range held over the past week or so. Spot prices currently trade around the 1.3070-1.3075 region, nearly unchanged for the day, as traders opt to wait on the sidelines ahead of the UK consumer inflation figures.
Heading into the key data risk, speculation that the Bank of England (BoE) might be headed towards speeding up its rate-cutting cycle continues to undermine the British Pound (GBP) and act as a headwind for the GBP/USD pair. That said, a modest US Dollar (USD) downtick offers some support to the currency pair and helps limit the downside.
From a technical perspective, the range-bound price action might still be categorized as a bearish consolidation phase against the backdrop of the recent pullback from the 1.3435 area, or the highest level since March 2022 touched last month. Furthermore, oscillators on the daily chart are holding in negative territory and are still far from being in the oversold zone.
This, in turn, suggests that the path of least resistance for the GBP/USD pair remains to the downside. Hence, a subsequent slide to the 1.3020 area, or a one-month low touched last Thursday, en route to the 1.3000 psychological mark, looks like a distinct possibility. The downfall could extend towards the 100-day Simple Moving Average (SMA), around mid-1.2900s.
On the flip side, the 1.3100 round figure is likely to act as an immediate hurdle ahead of the 1.3125 horizontal zone. A sustained strength beyond the latter might trigger a short-covering rally and allow the GBP/USD pair to aim to reclaim the 1.3200 mark. Spot prices could climb further towards the next relevant hurdle near the 1.3235-1.3240 region.
GBP/USD daily chart
Economic Indicator
Consumer Price Index (YoY)
The United Kingdom (UK) Consumer Price Index (CPI), released by the Office for National Statistics on a monthly basis, is a measure of consumer price inflation – the rate at which the prices of goods and services bought by households rise or fall – produced to international standards. It is the inflation measure used in the government’s target. The YoY reading compares prices in the reference month to a year earlier. Generally, a high reading is seen as bullish for the Pound Sterling (GBP), while a low reading is seen as bearish.
Read more.Next release: Wed Oct 16, 2024 06:00
Frequency: Monthly
Consensus: 1.9%
Previous: 2.2%
Source: Office for National Statistics
The Bank of England is tasked with keeping inflation, as measured by the headline Consumer Price Index (CPI) at around 2%, giving the monthly release its importance. An increase in inflation implies a quicker and sooner increase of interest rates or the reduction of bond-buying by the BOE, which means squeezing the supply of pounds. Conversely, a drop in the pace of price rises indicates looser monetary policy. A higher-than-expected result tends to be GBP bullish.
Author

Haresh Menghani
FXStreet
Haresh Menghani is a detail-oriented professional with 10+ years of extensive experience in analysing the global financial markets.

















