- GBP/USD remains upward biased but struggles to clear key resistance at 1.3200, with YTD high of 1.3266 looming.
- A pullback below 1.3150 could see the pair test support at 1.3087, with further downside to 1.3044 and the 50-DMA at 1.2925.
- Traders' rate cut expectations fluctuate, with a 43% chance for a 50-bps cut and 57% for a 25-bps cut.
The GBP/USD seesawed during the North American session as softer US jobs data increased. This kept investors uncertain of a 50—or 25-basis-point rate cut by the Fed at the September 17-18 meeting. The pair trades at 1.3172, virtually unchanged.
Federal Reserve interest rate expectations fluctuated after the US Nonfarm Payrolls report. Traders of fed funds futures increased their bets to a 70% chance for a 50-bps cut, yet they trimmed those odds. At the time of writing, the chances are 43%, while for a quarter of a percentage point cut, they are at 57%.
GBP/USD Price Forecast: Technical outlook
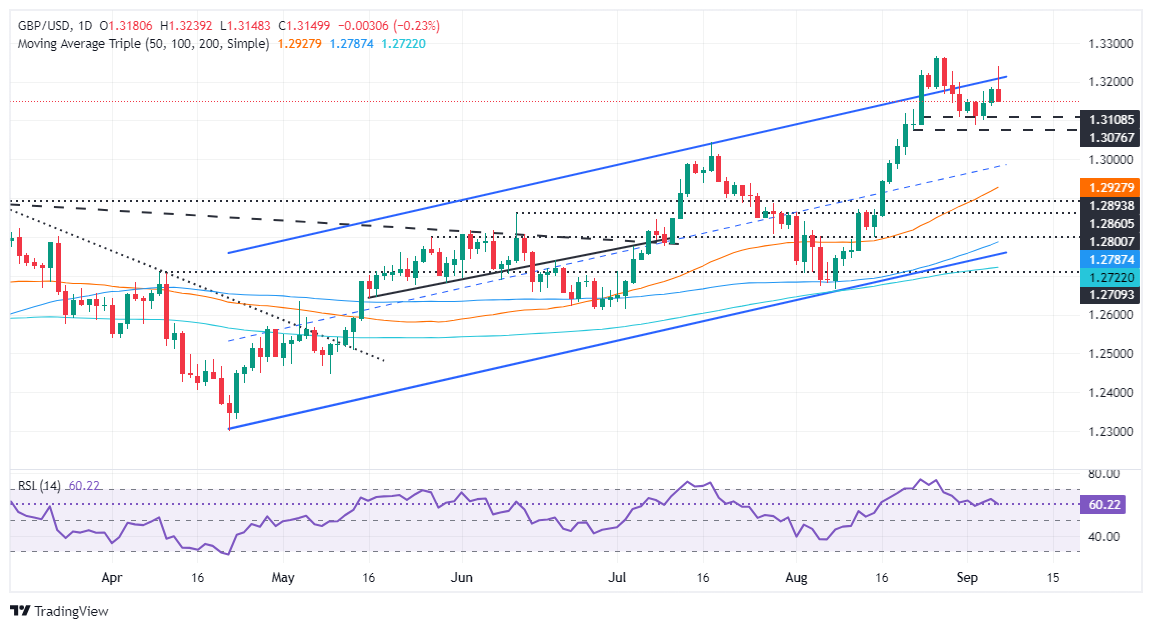
Given the backdrop, the technical view is that the GBP/USD is upward biased but failed to clear the year-to-date (YTD) peak of 1.3266, which exacerbated a dip below 1.3200 after hitting a high of 1.3239 on Friday.
With that in mind and buying momentum fading as shown by the Relative Strength Index (RSI), the GBP/USD could be headed for a pullback.
If GBP/USD retreats below 1.3150, the next support could be the September 3 low of 1.3087. On further weakness, the pair could aim toward the July 17 high at 1.3044 before moving towards the 50-day moving average (DMA) at 1.2925.
Conversely, if buyers stepped in and pushed prices above 1.3200, the next resistance would be the YTD high at 1.3266.
GBP/USD Price Action – Daily Chart
British Pound PRICE Today
The table below shows the percentage change of British Pound (GBP) against listed major currencies today. British Pound was the strongest against the Australian Dollar.
USD | EUR | GBP | JPY | CAD | AUD | NZD | CHF | |
---|---|---|---|---|---|---|---|---|
USD | 0.12% | 0.20% | -0.64% | 0.29% | 0.59% | 0.38% | -0.09% | |
EUR | -0.12% | 0.08% | -0.76% | 0.18% | 0.49% | 0.23% | -0.21% | |
GBP | -0.20% | -0.08% | -0.83% | 0.14% | 0.41% | 0.17% | -0.31% | |
JPY | 0.64% | 0.76% | 0.83% | 0.95% | 1.20% | 0.96% | 0.53% | |
CAD | -0.29% | -0.18% | -0.14% | -0.95% | 0.29% | 0.09% | -0.47% | |
AUD | -0.59% | -0.49% | -0.41% | -1.20% | -0.29% | -0.23% | -0.71% | |
NZD | -0.38% | -0.23% | -0.17% | -0.96% | -0.09% | 0.23% | -0.44% | |
CHF | 0.09% | 0.21% | 0.31% | -0.53% | 0.47% | 0.71% | 0.44% |
The heat map shows percentage changes of major currencies against each other. The base currency is picked from the left column, while the quote currency is picked from the top row. For example, if you pick the British Pound from the left column and move along the horizontal line to the US Dollar, the percentage change displayed in the box will represent GBP (base)/USD (quote).
Information on these pages contains forward-looking statements that involve risks and uncertainties. Markets and instruments profiled on this page are for informational purposes only and should not in any way come across as a recommendation to buy or sell in these assets. You should do your own thorough research before making any investment decisions. FXStreet does not in any way guarantee that this information is free from mistakes, errors, or material misstatements. It also does not guarantee that this information is of a timely nature. Investing in Open Markets involves a great deal of risk, including the loss of all or a portion of your investment, as well as emotional distress. All risks, losses and costs associated with investing, including total loss of principal, are your responsibility. The views and opinions expressed in this article are those of the authors and do not necessarily reflect the official policy or position of FXStreet nor its advertisers. The author will not be held responsible for information that is found at the end of links posted on this page.
If not otherwise explicitly mentioned in the body of the article, at the time of writing, the author has no position in any stock mentioned in this article and no business relationship with any company mentioned. The author has not received compensation for writing this article, other than from FXStreet.
FXStreet and the author do not provide personalized recommendations. The author makes no representations as to the accuracy, completeness, or suitability of this information. FXStreet and the author will not be liable for any errors, omissions or any losses, injuries or damages arising from this information and its display or use. Errors and omissions excepted.
The author and FXStreet are not registered investment advisors and nothing in this article is intended to be investment advice.
Recommended content
Editors’ Picks

AUD/USD remains heavy toward 0.6400 as RBA Bullock's presser gets underway
AUD/USD stays under heavy selling pressure and eyes 0.6400 in early Europe on Tuesday. The RBA cut interest rate by 25 bps to 3.85% and trimmed inflation and growth forecast on US tariffs impact, as expected. Governor Bullock's speaks on policy outlook at the press conference.

EUR/USD tests descending channel’s upper boundary near 1.1250
EUR/USD remains steady after registering more than 0.50% gains in the previous session, trading around 1.1240 during the Asian hours on Tuesday. On the daily chart, technical analysis indicates a bearish bias is in play, as the pair continues to trade lower within a descending channel pattern.

Gold price sticks to intraday losses amid positive risk tone; holds above $3,200
Gold price maintains its offered tone through the Asian session on Tuesday though it manages to hold above the $3,200 round figure. Against the backdrop of rising trade optimism, hopes for a Russia-Ukraine ceasefire remain supportive of a positive risk tone.

Solana set for a consensus switch with the introduction of Alpenglow
Solana (SOL) showed signs of recovery in the American trading session on Monday following the introduction of a new consensus protocol, Alpenglow, which would replace the network's current Proof-of-History and TowerBFT mechanisms.

China April slowdown shows the impact of economic uncertainty
Trade war uncertainty is denting Chinese confidence, resulting in slower economic activity in April. Retail sales and fixed-asset investment both underperformed forecasts amid heightened caution. Yet the impact on manufacturing was less than feared.