GBP/USD Price Forecast: Dives below 1.3000 and tests 100-DMA
- GBP/USD falls 0.15%, decisively breaking below the 1.3000 mark and testing the 100-DMA for the first time since August 2024.
- Momentum signals bearish control, with the RSI nearing recent lows, potentially pushing the pair toward the 1.2915/20 support zone.
- A break below 1.2915 could lead to a test of key support at 1.2798, while resistance lies at 1.2990 and the 50-DMA at 1.3135.

The Pound Sterling extended its losses against the US Dollar for two straight days, with sellers clearing the 1.3000 figure decisively, which could pave the way for further downside. At the time of writing, the GBP/USD trades at 1.2961, fluctuating around the 100-day moving average (DMA), down 0.15%.
GBP/USD Price Forecast: Technical outlook
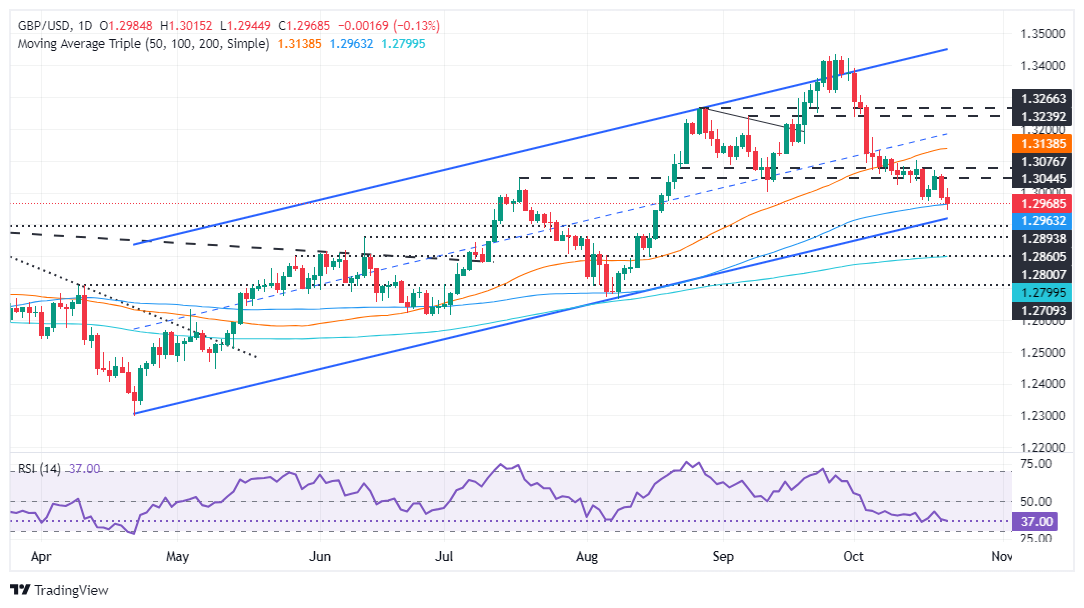
The GBP/USD is testing the 100-DMA for the first time since early August 2024. Although the pair hit a daily low of 1.2944, sellers lacked the strength to push the spot price toward the bottom trendline of an ascending channel.
Momentum shows that sellers are in charge. The Relative Strength Index (RSI) is dipping towards its most recent low, which, once broken, would signal bears to exert pressure on the pair.
If GBP/USD presses toward the bottom trendline and clears the support at around 1.2915/20, the exchange rate could likely hit 1.2900. The next key support level would be the confluence of the August 15 low and the 200-DMA at 1.2798
Conversely, if buyers stepped in and push the exchange rate past 1.2990, a move toward 1.3000 is on the cards. The next major resistance is found at the 50-DMA at 1.3135.
GBP/USD Price Chart – Daily
British Pound PRICE Today
The table below shows the percentage change of British Pound (GBP) against listed major currencies today. British Pound was the strongest against the Japanese Yen.
| USD | EUR | GBP | JPY | CAD | AUD | NZD | CHF | |
|---|---|---|---|---|---|---|---|---|
| USD | 0.08% | 0.11% | 0.09% | -0.06% | -0.37% | -0.28% | -0.08% | |
| EUR | -0.08% | 0.04% | 0.03% | -0.14% | -0.47% | -0.34% | -0.14% | |
| GBP | -0.11% | -0.04% | -0.02% | -0.17% | -0.50% | -0.39% | -0.19% | |
| JPY | -0.09% | -0.03% | 0.02% | -0.14% | -0.46% | -0.38% | -0.17% | |
| CAD | 0.06% | 0.14% | 0.17% | 0.14% | -0.31% | -0.22% | -0.03% | |
| AUD | 0.37% | 0.47% | 0.50% | 0.46% | 0.31% | 0.10% | 0.29% | |
| NZD | 0.28% | 0.34% | 0.39% | 0.38% | 0.22% | -0.10% | 0.20% | |
| CHF | 0.08% | 0.14% | 0.19% | 0.17% | 0.03% | -0.29% | -0.20% |
The heat map shows percentage changes of major currencies against each other. The base currency is picked from the left column, while the quote currency is picked from the top row. For example, if you pick the British Pound from the left column and move along the horizontal line to the US Dollar, the percentage change displayed in the box will represent GBP (base)/USD (quote).
Author

Christian Borjon Valencia
FXStreet
Markets analyst, news editor, and trading instructor with over 14 years of experience across FX, commodities, US equity indices, and global macro markets.


