GBP/USD Price Forecast: Stumbles and hovers around 1.2520, ahead of next week data
- GBP/USD sinks further following poor performances in key UK economic indicators and rising geopolitical concerns.
- Technical analysis highlights potential for the pair to test significant supports at 1.2445 and possibly the year-to-date low of 1.2299.
- RSI indicates oversold conditions, suggesting a heavy bearish pressure but not yet at extreme levels.

The Pound Sterling extends its losses against the Greenback for the third straight day, is down 0.47% after UK Flash PMIs and Retail Sales data disappointed investors. This and heightened geopolitical tensions due to Russia-Ukraine and Middle East conflicts, bolstered the American currency. At the time of writing, the GBP/USD trades at 1.2529 after hitting a daily high of 1.2594.
GBP/USD hovers around 1.2520; market players await next week’s US-UK docket
The market mood shifted positively, capping Greenback’s advance. Although the GBP/USD remains pressured, next week’s economic docket will be crucial in dictating the direction.
In the UK, the economic docket will be scarce. First, Bank of England (BoE) Deputy Governor Clare Lombardelli will give a speech on Monday, followed by the release of the CBI Distributive Trades. Next would be Car Production, Nationwide Housing Prices, and the Financial Stability Report.
Across the pond, the US schedule will feature housing data, the release of the Federal Reserve’s last meeting minutes, Durable Goods Orders and the release of the Fed’s preferred inflation gauge, the Core Personal Consumption Expenditures (PCE) Price Index,
GBP/USD Price Forecast: Technical outlook
The GBP/USD is trending down, extending its bearish bias. Sellers are eyeing intermediate support at 1.2445, the May 9 swing low. If breached, the pair could refresh year-to-date (YTD) lows of 1.2299, which were hit on April 22.
Indicators like the Relative Strength Index (RSI) turned oversold beneath the 30 level. Nevertheless, it has not reached extreme levels, usually seen in solid trends. In the case of a downtrend, the 20 level would suggest the GBP/USD is oversold.
Conversely, if bulls move in and reclaim 1.2600, look for a test of November’s 20 peaks at 1.2714 as the next resistance. If surpassed, the next stop would be the 200-day Simple Moving Average (SMA) at 1.2818.
GBP/USD Price Chart – Daily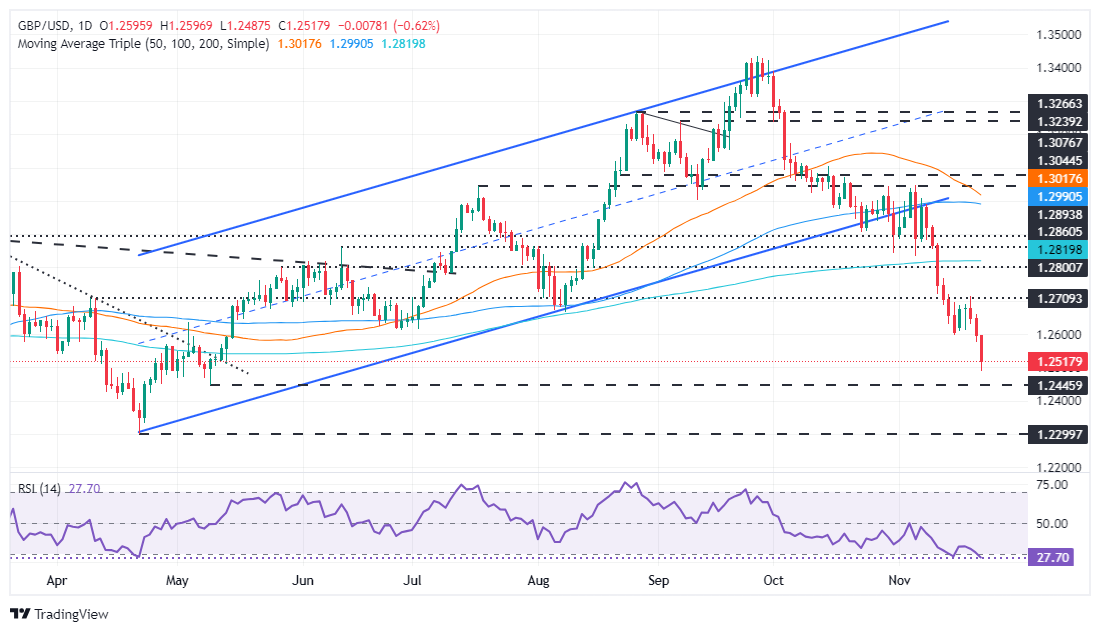
British Pound PRICE Today
The table below shows the percentage change of British Pound (GBP) against listed major currencies today. British Pound was the strongest against the Swiss Franc.
| USD | EUR | GBP | JPY | CAD | AUD | NZD | CHF | |
|---|---|---|---|---|---|---|---|---|
| USD | 0.72% | 0.63% | 0.25% | 0.10% | 0.25% | 0.57% | 0.94% | |
| EUR | -0.72% | -0.08% | -0.45% | -0.61% | -0.44% | -0.14% | 0.23% | |
| GBP | -0.63% | 0.08% | -0.37% | -0.53% | -0.38% | -0.06% | 0.31% | |
| JPY | -0.25% | 0.45% | 0.37% | -0.15% | 0.00% | 0.31% | 0.69% | |
| CAD | -0.10% | 0.61% | 0.53% | 0.15% | 0.14% | 0.47% | 0.84% | |
| AUD | -0.25% | 0.44% | 0.38% | 0.00% | -0.14% | 0.33% | 0.72% | |
| NZD | -0.57% | 0.14% | 0.06% | -0.31% | -0.47% | -0.33% | 0.36% | |
| CHF | -0.94% | -0.23% | -0.31% | -0.69% | -0.84% | -0.72% | -0.36% |
The heat map shows percentage changes of major currencies against each other. The base currency is picked from the left column, while the quote currency is picked from the top row. For example, if you pick the British Pound from the left column and move along the horizontal line to the US Dollar, the percentage change displayed in the box will represent GBP (base)/USD (quote).
Author

Christian Borjon Valencia
FXStreet
Markets analyst, news editor, and trading instructor with over 14 years of experience across FX, commodities, US equity indices, and global macro markets.


