GBP/USD Price Forecast: Consolidates at around 1.3000 due to soft US Dollar
- GBP/USD moves past 1.3000 as investors eye UK budget and potential Fed rate cuts following positive US jobs data.
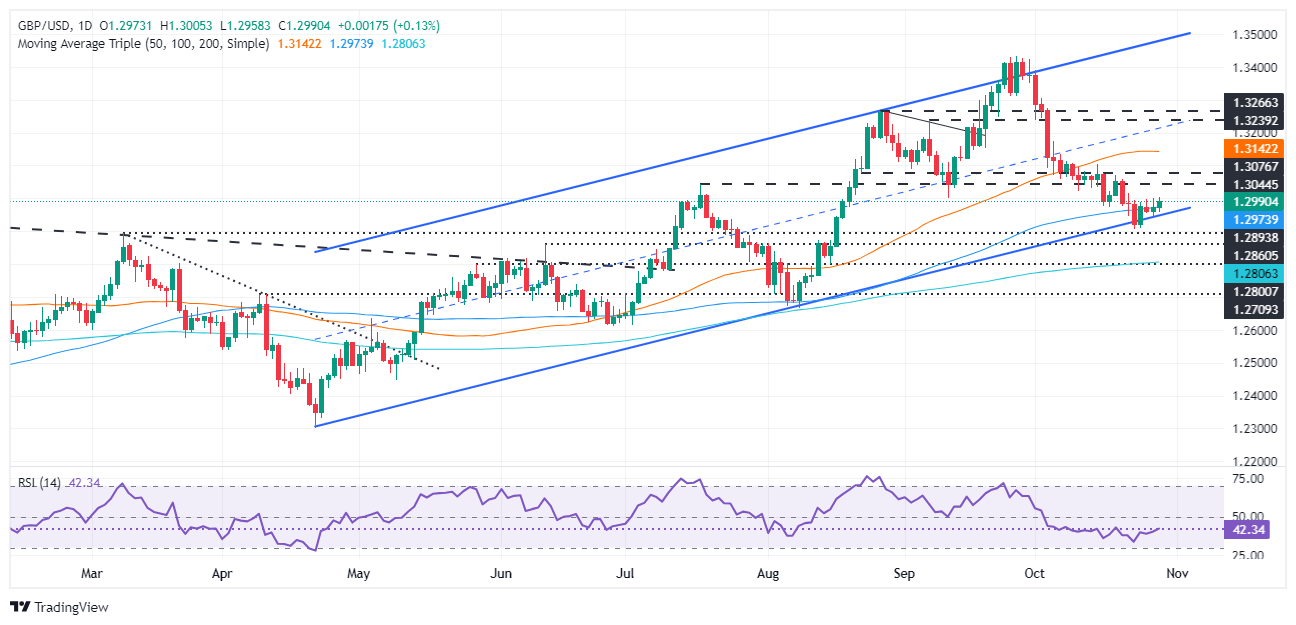
- Buyers maintain support at the 100-day SMA (1.2971), with a close above 1.3000 targeting resistance at 1.3100 and 50-day SMA at 1.3139.
- A close below 1.2971 could open the door for sellers to test 1.2900, with further downside risk to the 200-day SMA at 1.2804.

The Pound Sterling climbed past 1.3000 for the first time in five days after a US jobs report increased the chances that the Federal Reserve (Fed) would cut rates at the last two meetings in 2024. The GBP/USD trades at 1.2998, posting gains of over 0.21%.
GBP/USD Price Forecast: Technical outlook
The GBP/USD has been range-bound within the 1.2900/1.3000 mark, unable to break the bottom/top of the area. Investors remain reluctant to position themselves as they eye the release of the UK budget, seen as traders as the next catalyst, ahead of the policy decisions of the Bank of England and the Federal Reserve next week.
In the near term, the pair is tilted to the downside, but buyers are leaning toward the 100-day Simple Moving Average (SMA) at 1.2971, keeping sellers at bay. If the former pushes the GBP/USD above 1.3000 and achieves a daily close above the latter, further upside is seen, and 1.3100 would be the next key resistance level. Once surpassed, the 50-day SMA at 1.3139 emerges as the next supply zone.
Conversely, if sellers drive the exchange rate below the 100-day SMA at 1.2971, it could exacerbate a test of 1.2900. Bears could drive prices to the 200-day SMA at 1.2804 on further weakness.
GBP/USD Price Chart – Daily
British Pound PRICE Today
The table below shows the percentage change of British Pound (GBP) against listed major currencies today. British Pound was the strongest against the Australian Dollar.
| USD | EUR | GBP | JPY | CAD | AUD | NZD | CHF | |
|---|---|---|---|---|---|---|---|---|
| USD | 0.19% | -0.13% | 0.14% | 0.09% | 0.42% | 0.31% | 0.35% | |
| EUR | -0.19% | -0.32% | -0.05% | -0.06% | 0.23% | 0.13% | 0.20% | |
| GBP | 0.13% | 0.32% | 0.28% | 0.23% | 0.55% | 0.44% | 0.52% | |
| JPY | -0.14% | 0.05% | -0.28% | -0.03% | 0.29% | 0.17% | 0.26% | |
| CAD | -0.09% | 0.06% | -0.23% | 0.03% | 0.32% | 0.21% | 0.29% | |
| AUD | -0.42% | -0.23% | -0.55% | -0.29% | -0.32% | -0.11% | -0.05% | |
| NZD | -0.31% | -0.13% | -0.44% | -0.17% | -0.21% | 0.11% | 0.06% | |
| CHF | -0.35% | -0.20% | -0.52% | -0.26% | -0.29% | 0.05% | -0.06% |
The heat map shows percentage changes of major currencies against each other. The base currency is picked from the left column, while the quote currency is picked from the top row. For example, if you pick the British Pound from the left column and move along the horizontal line to the US Dollar, the percentage change displayed in the box will represent GBP (base)/USD (quote).
Author

Christian Borjon Valencia
FXStreet
Markets analyst, news editor, and trading instructor with over 14 years of experience across FX, commodities, US equity indices, and global macro markets.


