GBP/USD Price Forecast: Bulls retain control near 1.3300 mark, highest since March 2022
- GBP/USD attracts buyers for the third straight day and draws support from a combination of factors.
- The BoE’s decision to keep rates unchanged acts as a tailwind amid dovish Fed-inspired USD decline.
- The technical setup remains tilted in favor of bulls and supports prospects for further near-term gains.

The GBP/USD pair trades with a positive bias for the third straight day on Friday and hovers around the 1.3300 mark during the Asian session, just below its highest level since March 2022 touched the previous day.
The British Pound (GBP) continues to draw support from the Bank of England's (BoE) decision on Thursday to keep interest rates unchanged and run down its stock of government bonds by another £100 billion over the coming 12 months. In contrast, the US Dollar (USD) languishes near its lowest level since July 2023 amid bets for more interest rate cuts by the Federal Reserve (Fed) and turns out to be a key factor acting as a tailwind for the GBP/USD pair.
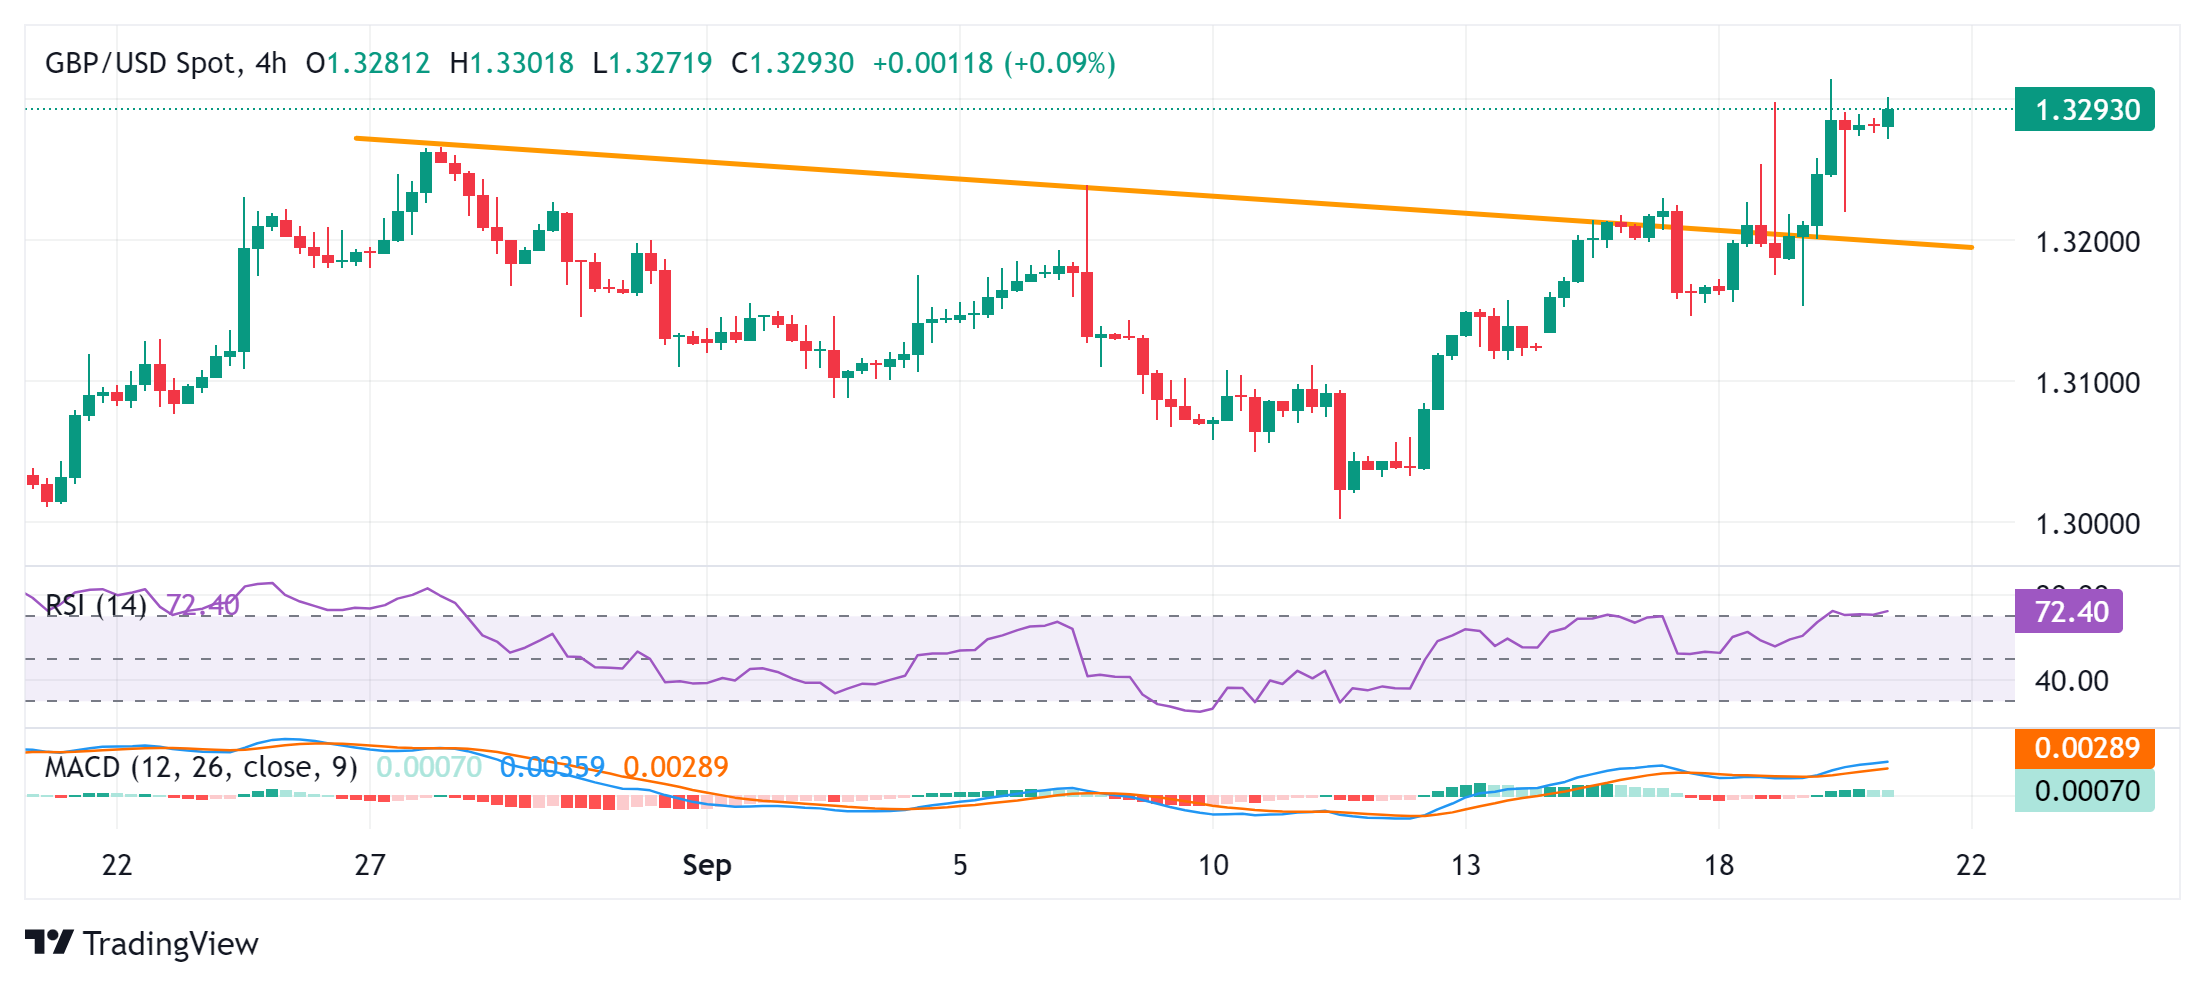
From a technical perspective, the overnight sustained breakout through a short-term descending trend-line extending from the late August swing high was seen as a fresh trigger for bullish traders. Moreover, oscillators on the daily chart are holding in positive territory and suggest that the path of least resistance for the GBP/USD pair is to the upside. That said, the Relative Strength Index (RSI) on the daily chart is flashing slightly overbought conditions.
This makes it prudent to wait for some intraday consolidation or a modest pullback before traders start positioning for the next leg of a positive move. Nevertheless, the GBP/USD pair seems poised to climb further towards the next relevant hurdle near the 1.3365 region before aiming to reclaim the 1.3400 mark and test the March 2022 swing high, around the 1.3435-1.3440 region.
On the flip side, the 1.3265-1.3260 area, or the previous YTD peak, now seems to protect the immediate downside. Any further decline is more likely to attract fresh buyers and remain cushioned near the aforementioned descending trend-line resistance, now turned support near the 1.3200 mark. The latter should act as a key pivotal point, which if broken decisively could accelerate the corrective decline towards testing the 1.3150 strong horizontal support.
GBP/USD 4-hour chart
US Dollar PRICE Today
The table below shows the percentage change of US Dollar (USD) against listed major currencies today. US Dollar was the strongest against the Canadian Dollar.
| USD | EUR | GBP | JPY | CAD | AUD | NZD | CHF | |
|---|---|---|---|---|---|---|---|---|
| USD | -0.03% | -0.06% | -0.33% | 0.00% | -0.07% | -0.09% | -0.21% | |
| EUR | 0.03% | -0.04% | -0.27% | 0.01% | -0.05% | -0.05% | -0.18% | |
| GBP | 0.06% | 0.04% | -0.23% | 0.08% | 0.01% | -0.00% | -0.12% | |
| JPY | 0.33% | 0.27% | 0.23% | 0.32% | 0.23% | 0.22% | 0.12% | |
| CAD | -0.00% | -0.01% | -0.08% | -0.32% | -0.08% | -0.08% | -0.20% | |
| AUD | 0.07% | 0.05% | -0.01% | -0.23% | 0.08% | 0.01% | -0.10% | |
| NZD | 0.09% | 0.05% | 0.00% | -0.22% | 0.08% | -0.01% | -0.11% | |
| CHF | 0.21% | 0.18% | 0.12% | -0.12% | 0.20% | 0.10% | 0.11% |
The heat map shows percentage changes of major currencies against each other. The base currency is picked from the left column, while the quote currency is picked from the top row. For example, if you pick the US Dollar from the left column and move along the horizontal line to the Japanese Yen, the percentage change displayed in the box will represent USD (base)/JPY (quote).
Author

Haresh Menghani
FXStreet
Haresh Menghani is a detail-oriented professional with 10+ years of extensive experience in analysing the global financial markets.