GBP/USD Price Forecast: Bounces from weekly lows as ‘hammer’ hints reversal
- GBP/USD edges up after bottoming out at 1.3010, with a ‘hammer’ pattern signaling potential for further upside.
- Clearing the October 10 high of 1.3093 and the 50-DMA at 1.3099 would open the door for buyers, with resistance at 1.3113 and 1.3134.
- A failure to break 1.3100 could see sellers push the pair back toward the week’s low of 1.3010.

The Pound Sterling recovers some ground against the greenback as a ‘hammer’ emerges on the daily chart and rises above 1.3050, registering gains of over 0.15%. Goodish economic data in the UK sponsored the GBP/USD’s recovery as the economy grew around estimates. Nevertheless, a slightly hot Producer Price Index (PPI) report in the US capped the GBP’s gains.
GBP/USD Price Forecast: Technical outlook
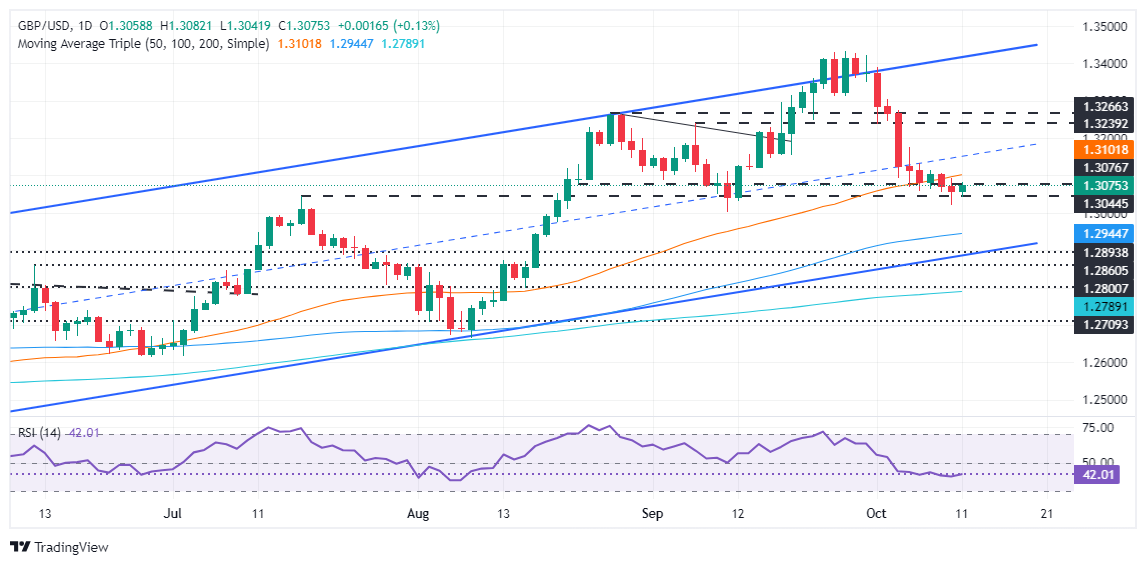
The GBP/USD seems to have bottomed out after retreating from yearly highs of 1.3434 to a daily low of 1.3010 on October 10. A ‘hammer’ formation preceded by a downtrend hints that a reversal is possible.
Nevertheless, the pair should clear the October 10 high of 1.3093, immediately followed by the 50-day moving average (DMA) at 1.3099, so buyers could remain hopeful of higher exchange rates.
In that outcome, the GBP/USD next resistance would be the 1.3100 figure, followed by the October 8 high at 1.3113. On further strength, the next supply zone will be the October 7 weekly high of 1.3134.
Conversely, if GBP/USD fails to clear 1.3100, sellers could step in and push prices below the psychological 1.3050 level, driving the exchange rate toward the week's lows at 1.3010.
From a momentum standpoint, the GBP/USD is barely biased, but the Relative Strength Index (RSI) has increased upwards during the last couple of days, opening the door for a leg-up.
GBP/USD Price Action – Daily Chart
British Pound PRICE Today
The table below shows the percentage change of British Pound (GBP) against listed major currencies today. British Pound was the strongest against the Japanese Yen.
| USD | EUR | GBP | JPY | CAD | AUD | NZD | CHF | |
|---|---|---|---|---|---|---|---|---|
| USD | -0.14% | -0.14% | 0.45% | 0.12% | -0.13% | -0.11% | 0.12% | |
| EUR | 0.14% | -0.05% | 0.54% | 0.21% | -0.00% | -0.03% | 0.20% | |
| GBP | 0.14% | 0.05% | 0.59% | 0.26% | 0.06% | 0.02% | 0.27% | |
| JPY | -0.45% | -0.54% | -0.59% | -0.33% | -0.55% | -0.57% | -0.40% | |
| CAD | -0.12% | -0.21% | -0.26% | 0.33% | -0.23% | -0.24% | 0.00% | |
| AUD | 0.13% | 0.00% | -0.06% | 0.55% | 0.23% | -0.04% | 0.19% | |
| NZD | 0.11% | 0.03% | -0.02% | 0.57% | 0.24% | 0.04% | 0.25% | |
| CHF | -0.12% | -0.20% | -0.27% | 0.40% | -0.01% | -0.19% | -0.25% |
The heat map shows percentage changes of major currencies against each other. The base currency is picked from the left column, while the quote currency is picked from the top row. For example, if you pick the British Pound from the left column and move along the horizontal line to the US Dollar, the percentage change displayed in the box will represent GBP (base)/USD (quote).
Author

Christian Borjon Valencia
FXStreet
Markets analyst, news editor, and trading instructor with over 14 years of experience across FX, commodities, US equity indices, and global macro markets.


