GBP/USD Price Forecast: Begins September with minimal gains
- GBP/USD fails to hold above July high of 1.3142, closing August at 1.3122, hinting at possible consolidation.
- Daily chart reveals a ‘bullish-harami’ pattern; clearing 1.3199 could aim for YTD high of 1.3266.
- Downside break below 1.3109 risks fall to 1.3044 and further to the 50-DMA at 1.2894.
- Momentum leans neutral to bullish, with RSI positive but stabilizing.

The GBP/USD begins September on a slight positive tone and trades at 1.3152, up by over 0.20% during the North American session. The session is expected to be light as US financial markets remain closed in observance of Labor Day.
GBP/USD Price Forecast: Technical outlook
The GBP/USD monthly chart witnessed a breakout failure of the July 2023 monthly high of 1.3142. Traders failed to achieve a daily close above the latter, ending August at 1.3122.
From a weekly chart standpoint, the GBP/USD is set for consolidation at around the 1.3140-1.3270 range before the release of US Nonfarm Payrolls data, which would be crucial for the US Federal Reserve to determine the size of the first-rate cut at the September 18 meeting.
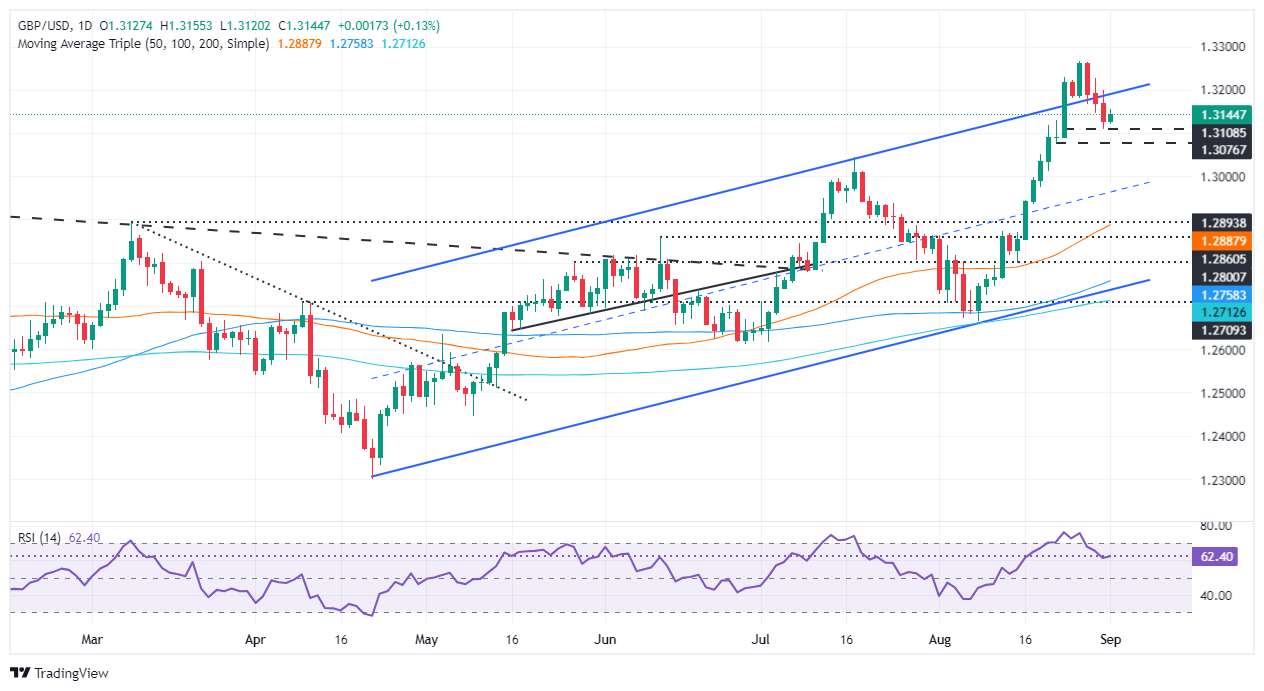
Meanwhile, from a daily chart point of view, the GBP/USD is forming a ‘bullish-harami’ candle chart pattern, though traders must clear last Friday’s peak at 1.3199 before the pair can aim toward the year-to-date (YTD) highs of 1.3266.
Conversely, if GBP/USD consolidates and breaks below the August 29 swing low of 1.3109, this could exacerbate a drop toward the latest support level seen at the July 17 swing high of 1.3044 before slumping to the 50-day moving average (DMA) at 1.2894.
Momentum is neutral to bullish biased, as the Relative Strength Index (RSI) is in bullish territory but has turned flat.
GBP/USD Price Action – Daily Chart
British Pound PRICE Today
The table below shows the percentage change of British Pound (GBP) against listed major currencies today. British Pound was the strongest against the Japanese Yen.
| USD | EUR | GBP | JPY | CAD | AUD | NZD | CHF | |
|---|---|---|---|---|---|---|---|---|
| USD | -0.15% | -0.13% | 0.60% | 0.07% | -0.31% | 0.23% | 0.32% | |
| EUR | 0.15% | 0.03% | 0.75% | 0.20% | -0.14% | 0.37% | 0.46% | |
| GBP | 0.13% | -0.03% | 0.70% | 0.15% | -0.20% | 0.37% | 0.39% | |
| JPY | -0.60% | -0.75% | -0.70% | -0.58% | -0.87% | -0.24% | -0.36% | |
| CAD | -0.07% | -0.20% | -0.15% | 0.58% | -0.33% | 0.15% | 0.24% | |
| AUD | 0.31% | 0.14% | 0.20% | 0.87% | 0.33% | 0.51% | 0.60% | |
| NZD | -0.23% | -0.37% | -0.37% | 0.24% | -0.15% | -0.51% | 0.08% | |
| CHF | -0.32% | -0.46% | -0.39% | 0.36% | -0.24% | -0.60% | -0.08% |
The heat map shows percentage changes of major currencies against each other. The base currency is picked from the left column, while the quote currency is picked from the top row. For example, if you pick the British Pound from the left column and move along the horizontal line to the US Dollar, the percentage change displayed in the box will represent GBP (base)/USD (quote).
Author

Christian Borjon Valencia
FXStreet
Markets analyst, news editor, and trading instructor with over 14 years of experience across FX, commodities, US equity indices, and global macro markets.


