GBP/USD Price Analysis: Teases bearish cross below 1.3900 on BOE Super Thursday


  • GBP/USD remains pressured after declining from weekly top.
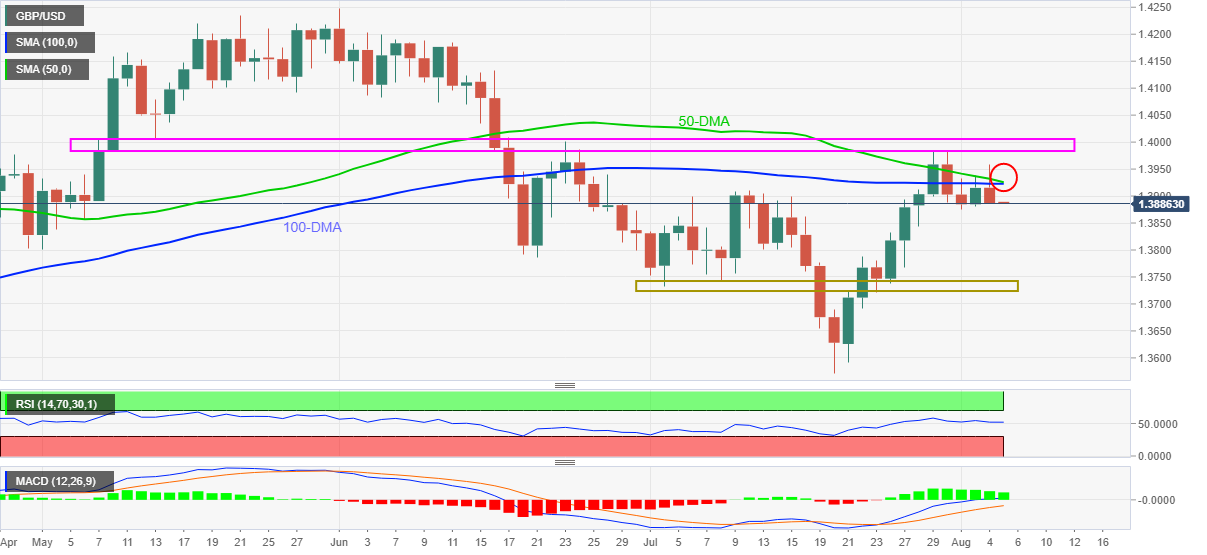
  • 50-DMA signals decline below 100-DMA amid receding bullish bias of MACD, steady RSI.
  • DMA confluence, two-month-old horizontal area act as strong resistances.
  • Bears could aim for June’s low if welcomed.

After posting the heaviest fall in a week, not to forget reversing from the weekly top, GBP/USD holds lower ground near 1.3885 during Thursday’s Asian session.

The cable pair traders remain cautious ahead of today’s Bank of England (BOE) monetary policy announcements while seeking clues of tapering and rate hikes. However, the Delta covid variant fears challenge the policymakers at the “Old Lady”.

Read: Bank of England Preview: Five reasons the doves are set to win Super Thursday, GBP/USD may dip

In addition to the “Super Thursday” event, an impending bearish cross of 50-DMA to the 100-DMA also tests the GBP/USD traders. It should be noted that steady RSI line and receding bullish MACD histograms tease sellers.

Hence, sustained trading below the weekly bottom surrounding 1.3875 will be required to confirm the bearish DMA pattern and drag the quote towards June’s low of 1.3786.

However, one-month-old horizontal support near 1.3740-20 could restrict the pair’s downside afterward.

Meanwhile, recovery moves will be initially challenged by a convergence of the said Daily Moving Averages (DMAs) around 1.3925 before directing the pair buyers towards 1.3985–4010 broad area comprising multiple levels marked since early May.

If at all the GBP/USD bulls cross 1.4010 on a daily closing basis, backed by hawkish BOE, the 1.4100 threshold will be next on their radar.

GBP/USD: Daily chart

Trend: Further weakness expected

Additional important levels

Overview
Today last price 1.3887
Today Daily Change -0.0028
Today Daily Change % -0.20%
Today daily open 1.3915
 
Trends
Daily SMA20 1.3822
Daily SMA50 1.3937
Daily SMA100 1.3924
Daily SMA200 1.3744
 
Levels
Previous Daily High 1.3939
Previous Daily Low 1.3882
Previous Weekly High 1.3984
Previous Weekly Low 1.3737
Previous Monthly High 1.3984
Previous Monthly Low 1.3572
Daily Fibonacci 38.2% 1.3917
Daily Fibonacci 61.8% 1.3903
Daily Pivot Point S1 1.3885
Daily Pivot Point S2 1.3855
Daily Pivot Point S3 1.3828
Daily Pivot Point R1 1.3942
Daily Pivot Point R2 1.3969
Daily Pivot Point R3 1.3999


Share: Feed news

Information on these pages contains forward-looking statements that involve risks and uncertainties. Markets and instruments profiled on this page are for informational purposes only and should not in any way come across as a recommendation to buy or sell in these assets. You should do your own thorough research before making any investment decisions. FXStreet does not in any way guarantee that this information is free from mistakes, errors, or material misstatements. It also does not guarantee that this information is of a timely nature. Investing in Open Markets involves a great deal of risk, including the loss of all or a portion of your investment, as well as emotional distress. All risks, losses and costs associated with investing, including total loss of principal, are your responsibility. The views and opinions expressed in this article are those of the authors and do not necessarily reflect the official policy or position of FXStreet nor its advertisers. The author will not be held responsible for information that is found at the end of links posted on this page.

If not otherwise explicitly mentioned in the body of the article, at the time of writing, the author has no position in any stock mentioned in this article and no business relationship with any company mentioned. The author has not received compensation for writing this article, other than from FXStreet.

FXStreet and the author do not provide personalized recommendations. The author makes no representations as to the accuracy, completeness, or suitability of this information. FXStreet and the author will not be liable for any errors, omissions or any losses, injuries or damages arising from this information and its display or use. Errors and omissions excepted.

The author and FXStreet are not registered investment advisors and nothing in this article is intended to be investment advice.

Recommended content


Recommended content

Editors’ Picks

EUR/USD holds below 1.0750 ahead of key US data

EUR/USD holds below 1.0750 ahead of key US data

EUR/USD trades in a tight range below 1.0750 in the European session on Friday. The US Dollar struggles to gather strength ahead of key PCE Price Index data, the Fed's preferred gauge of inflation, and helps the pair hold its ground. 

EUR/USD News

USD/JPY stays firm above 156.00 after BoJ Governor Ueda's comments

USD/JPY stays firm above 156.00 after BoJ Governor Ueda's comments

USD/JPY stays firm above 156.00 after surging above this level on the Bank of Japan's decision to leave the policy settings unchanged. BoJ Governor said weak Yen was not impacting prices but added that they will watch FX developments closely.

USD/JPY News

Gold price oscillates in a range as the focus remains glued to the US PCE Price Index

Gold price oscillates in a range as the focus remains glued to the US PCE Price Index

Gold price struggles to attract any meaningful buyers amid the emergence of fresh USD buying. Bets that the Fed will keep rates higher for longer amid sticky inflation help revive the USD demand.

Gold News

Bitcoin Weekly Forecast: BTC’s next breakout could propel it to $80,000 Premium

Bitcoin Weekly Forecast: BTC’s next breakout could propel it to $80,000

Bitcoin’s recent price consolidation could be nearing its end as technical indicators and on-chain metrics suggest a potential upward breakout. However, this move would not be straightforward and could punish impatient investors. 

Read more

US core PCE inflation set to signal firm price pressures as markets delay Federal Reserve rate cut bets

US core PCE inflation set to signal firm price pressures as markets delay Federal Reserve rate cut bets

The core PCE Price Index, which excludes volatile food and energy prices, is seen as the more influential measure of inflation in terms of Fed positioning. The index is forecast to rise 0.3% on a monthly basis in March, matching February’s increase. 

Read more

Forex MAJORS

Cryptocurrencies

Signatures