• GBP/USD remains unchanged after ISM Services PMI indicates economic expansion in May.
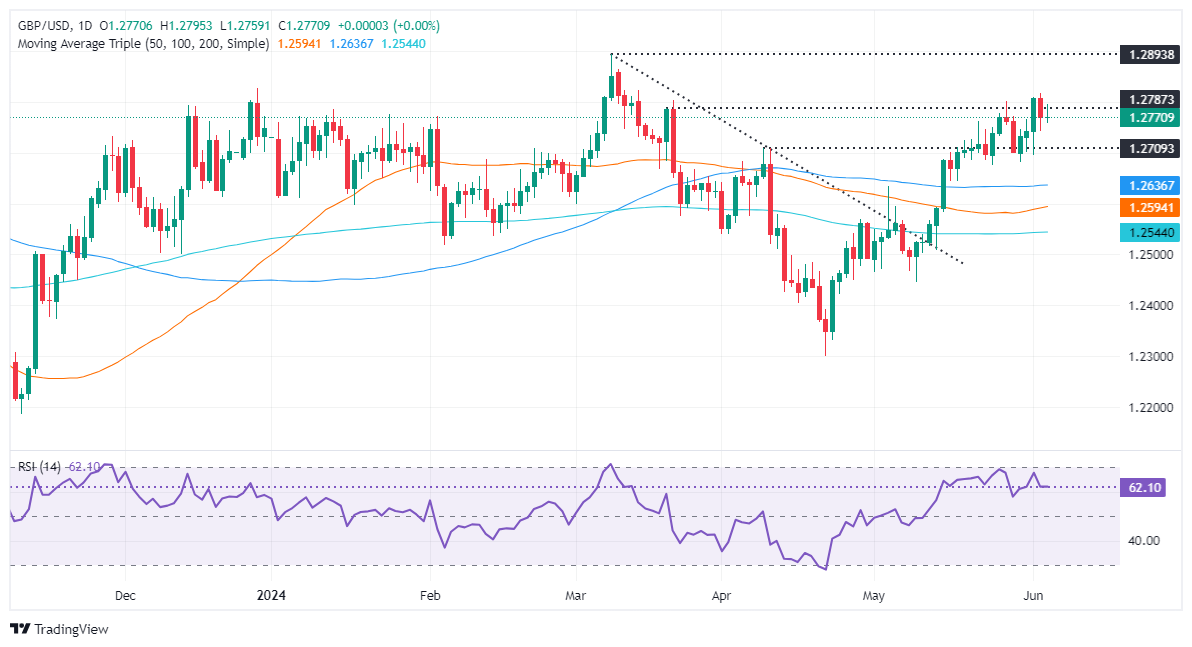
  • Technical outlook shows neutral to upward bias, but resistance at 1.2800 limits gains.
  • Key levels: Support at 1.2742, 1.2700, and 1.2634; Resistance at 1.2800, YTD high at 1.2893, and 1.2900.

The GBP/USD is virtually unchanged in early trading during the North American session, following the release of the Institute for Supply Management (ISM) Services PMI, which showed the economy remains resilient, expanded in May above estimates and the previous month's reading, contrarily to manufacturing activity. Therefore, the major trades at 1.2768, almost flat.

GBP/USD Price Analysis: Technical outlook

Looking at the daily chart, the GBP/USD is showing a neutral to upward bias. However, the failure to break through the confluence of a three-month-old downslope resistance trendline and the 1.2800 figure has led to a further decline in Cable’s value.

Momentum remains supportive of buyers, as the Relative Strength Index (RSI) shifted almost flat, though in bullish territory, while price action hints at bearish signals.

If sellers push the GBP/USD below yesterday’s low of 1.2742, a drop toward 1.2700 is on the cards. Further losses are seen beneath the June 3 low of 1.2694, like the confluence of the 100-day moving average (DMA) and the May 3 high of 1.2634.

Conversely, if buyers keep the exchange rate within the 1.2740 – 1.2800 range, they could lift the spot prices and challenge the abovementioned confluence, at around the top of the range. Gains lie overhead at the year-to-date (YTD) high of 1.2893, followed by the 1.2900 mark.

GBP/USD Price Action – Daily Chart

GBP/USD

Overview
Today last price 1.2761
Today Daily Change -0.0010
Today Daily Change % -0.08
Today daily open 1.2771
 
Trends
Daily SMA20 1.268
Daily SMA50 1.2592
Daily SMA100 1.2636
Daily SMA200 1.2544
 
Levels
Previous Daily High 1.2818
Previous Daily Low 1.2743
Previous Weekly High 1.2801
Previous Weekly Low 1.2681
Previous Monthly High 1.2801
Previous Monthly Low 1.2446
Daily Fibonacci 38.2% 1.2772
Daily Fibonacci 61.8% 1.2789
Daily Pivot Point S1 1.2736
Daily Pivot Point S2 1.2702
Daily Pivot Point S3 1.2662
Daily Pivot Point R1 1.2811
Daily Pivot Point R2 1.2852
Daily Pivot Point R3 1.2886


Share: Feed news

Information on these pages contains forward-looking statements that involve risks and uncertainties. Markets and instruments profiled on this page are for informational purposes only and should not in any way come across as a recommendation to buy or sell in these assets. You should do your own thorough research before making any investment decisions. FXStreet does not in any way guarantee that this information is free from mistakes, errors, or material misstatements. It also does not guarantee that this information is of a timely nature. Investing in Open Markets involves a great deal of risk, including the loss of all or a portion of your investment, as well as emotional distress. All risks, losses and costs associated with investing, including total loss of principal, are your responsibility. The views and opinions expressed in this article are those of the authors and do not necessarily reflect the official policy or position of FXStreet nor its advertisers. The author will not be held responsible for information that is found at the end of links posted on this page.

If not otherwise explicitly mentioned in the body of the article, at the time of writing, the author has no position in any stock mentioned in this article and no business relationship with any company mentioned. The author has not received compensation for writing this article, other than from FXStreet.

FXStreet and the author do not provide personalized recommendations. The author makes no representations as to the accuracy, completeness, or suitability of this information. FXStreet and the author will not be liable for any errors, omissions or any losses, injuries or damages arising from this information and its display or use. Errors and omissions excepted.

The author and FXStreet are not registered investment advisors and nothing in this article is intended to be investment advice.

XM
Account
7.2
Tools
9.2
Service
9.4
Trading
9.0
Trust
7.0
Experience
8.4
Read review
Moneta Markets
Account
7.4
Tools
6.6
Service
8.0
Trading
6.6
Trust
5.2
Experience
9.2
Read review
Trading Pro
Account
7.2
Tools
5.2
Service
6.6
Trading
8.0
Trust
5.0
Experience
7.0
Read review
Pepperstone
Account
8.2
Tools
8.2
Service
7.4
Trading
9.0
Trust
8.8
Experience
9.0
Read review
XM
Read review
Moneta Markets
Read review
Trading Pro
Read review
Pepperstone
Read review
Trading Pro
Read review
Pepperstone
Read review
XM
Read review
Moneta Markets
Read review
Trading Pro
Account
7.2
Tools
5.2
Service
6.6
Trading
8.0
Trust
5.0
Experience
7.0
Read review
Pepperstone
Account
8.2
Tools
8.2
Service
7.4
Trading
9.0
Trust
8.8
Experience
9.0
Read review
XM
Account
7.2
Tools
9.2
Service
9.4
Trading
9.0
Trust
7.0
Experience
8.4
Read review
Moneta Markets
Account
7.4
Tools
6.6
Service
8.0
Trading
6.6
Trust
5.2
Experience
9.2
Read review

Recommended content


Recommended content

Editors’ Picks

EUR/USD accelerates losses to 1.0930 on stronger Dollar

EUR/USD accelerates losses to 1.0930 on stronger Dollar

The US Dollar's recovery regains extra impulse sending the US Dollar Index to fresh highs and relegating EUR/USD to navigate the area of daily troughs around 1.0930 in the latter part of Friday's session.

EUR/USD News
GBP/USD plummets to four-week lows near 1.2850

GBP/USD plummets to four-week lows near 1.2850

The US Dollar's rebound keep gathering steam and now sends GBP/USD to the area of multi-week lows in the 1.2850 region amid the broad-based pullback in the risk-associated universe.

GBP/USD News
Gold trades on the back foot, flirts with $3,000

Gold trades on the back foot, flirts with $3,000

Gold prices are accelerating their daily decline, steadily approaching the critical $3,000 per troy ounce mark as the Greenback's rebound gains extra momentum and US yields tighten their retracement.

Gold News
Can Maker break $1,450 hurdle as whales launch buying spree?

Can Maker break $1,450 hurdle as whales launch buying spree?

Maker holds steadily above $1,250 support as a whale scoops $1.21 million worth of MKR. Addresses with a 100k to 1 million MKR balance now account for 24.27% of Maker’s total supply. Maker battles a bear flag pattern as bulls gather for an epic weekend move.

Read more
Strategic implications of “Liberation Day”

Strategic implications of “Liberation Day”

Liberation Day in the United States came with extremely protectionist and inward-looking tariff policy aimed at just about all U.S. trading partners. In this report, we outline some of the more strategic implications of Liberation Day and developments we will be paying close attention to going forward.

Read more
The Best brokers to trade EUR/USD

The Best brokers to trade EUR/USD

SPONSORED Discover the top brokers for trading EUR/USD in 2025. Our list features brokers with competitive spreads, fast execution, and powerful platforms. Whether you're a beginner or an expert, find the right partner to navigate the dynamic Forex market.

Read More

Forex MAJORS

Cryptocurrencies

Signatures

Best Brokers of 2025