GBP/USD Price Analysis: Stays defensive above 50-DMA ahead of US/UK PMI data


  • GBP/USD struggles to defend the bounce off short-term moving average ahead of US, UK PMI numbers for May.
  • Bearish MACD signals, steady RSI suggests further downside toward February’s high.
  • Ascending support line from October 2022 appears a tough nut to crack for Pound Sterling bears.
  • Cable buyers need validation from seven-week-old previous support line.

GBP/USD aptly portrays the pre-data anxiety as it dribbles around 1.2430 during early Tuesday morning in London. In doing so, the Cable pair marks the traders’ cautious mood ahead of the first readings of the UK’s S&P Global/CIPS PMI for May, as well as the US S&P Global PMIs for the said month.

Also read: GBP/USD recovers to 1.2450 amid US debt ceiling struggle, US/UK PMIs eyed

It’s worth noting that the quote’s downside break of a nearly two-month-old ascending trend line, marked in the last week, joins the bearish MACD signals to keep the GBP/USD sellers hopeful.

However, the steady RSI (14) line near the 50.0 level and the 50-DMA support surrounding 1.2420, quickly followed by the 1.2400 round figures, challenge the GBP/USD bears.

Following that, a quick fall towards February’s high of near 1.2270 can’t be ruled out. Though, an upward-sloping support line from October 2022, close to 1.2255 by the press time, appears a tough nut to crack for the bears.

Meanwhile, the GBP/USD pair’s recovery needs to cross the support-turned-resistance line of around 1.2500, to recall the Pound Sterling buyers.

Should the Cable price remains firmer past 1.2500, backed by upbeat UK data, the odds of witnessing a run-up toward the yearly high of 1.2680 can’t be ruled out.

GBP/USD: Daily chart

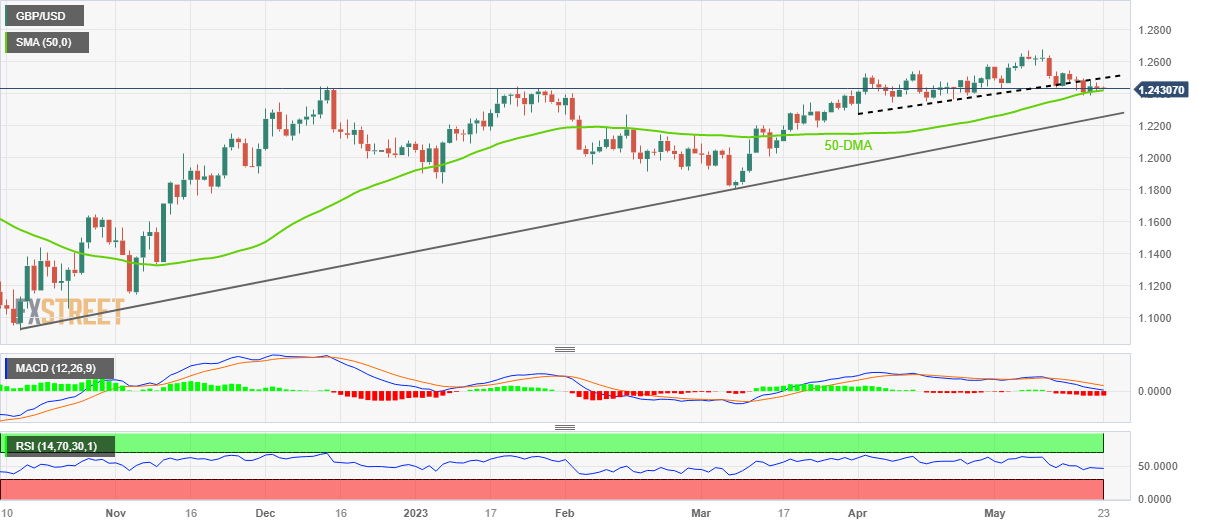
Trend: Further downside expected

Additional important levels

Overview
Today last price 1.2436
Today Daily Change -0.0001
Today Daily Change % -0.01%
Today daily open 1.2437
 
Trends
Daily SMA20 1.2515
Daily SMA50 1.2416
Daily SMA100 1.2274
Daily SMA200 1.1971
 
Levels
Previous Daily High 1.2472
Previous Daily Low 1.2414
Previous Weekly High 1.2547
Previous Weekly Low 1.2392
Previous Monthly High 1.2584
Previous Monthly Low 1.2275
Daily Fibonacci 38.2% 1.2436
Daily Fibonacci 61.8% 1.245
Daily Pivot Point S1 1.241
Daily Pivot Point S2 1.2382
Daily Pivot Point S3 1.2351
Daily Pivot Point R1 1.2468
Daily Pivot Point R2 1.25
Daily Pivot Point R3 1.2527


Share: Feed news

Information on these pages contains forward-looking statements that involve risks and uncertainties. Markets and instruments profiled on this page are for informational purposes only and should not in any way come across as a recommendation to buy or sell in these assets. You should do your own thorough research before making any investment decisions. FXStreet does not in any way guarantee that this information is free from mistakes, errors, or material misstatements. It also does not guarantee that this information is of a timely nature. Investing in Open Markets involves a great deal of risk, including the loss of all or a portion of your investment, as well as emotional distress. All risks, losses and costs associated with investing, including total loss of principal, are your responsibility. The views and opinions expressed in this article are those of the authors and do not necessarily reflect the official policy or position of FXStreet nor its advertisers. The author will not be held responsible for information that is found at the end of links posted on this page.

If not otherwise explicitly mentioned in the body of the article, at the time of writing, the author has no position in any stock mentioned in this article and no business relationship with any company mentioned. The author has not received compensation for writing this article, other than from FXStreet.

FXStreet and the author do not provide personalized recommendations. The author makes no representations as to the accuracy, completeness, or suitability of this information. FXStreet and the author will not be liable for any errors, omissions or any losses, injuries or damages arising from this information and its display or use. Errors and omissions excepted.

The author and FXStreet are not registered investment advisors and nothing in this article is intended to be investment advice.

Recommended content


Recommended content

Editors’ Picks

EUR/USD holds above 1.0700 ahead of key US data

EUR/USD holds above 1.0700 ahead of key US data

EUR/USD trades in a tight range above 1.0700 in the early European session on Friday. The US Dollar struggles to gather strength ahead of key PCE Price Index data, the Fed's preferred gauge of inflation, and helps the pair hold its ground. 

EUR/USD News

USD/JPY stays above 156.00 after BoJ Governor Ueda's comments

USD/JPY stays above 156.00 after BoJ Governor Ueda's comments

USD/JPY holds above 156.00 after surging above this level with the initial reaction to the Bank of Japan's decision to leave the policy settings unchanged. BoJ Governor said weak Yen was not impacting prices but added that they will watch FX developments closely.

USD/JPY News

Gold price oscillates in a range as the focus remains glued to the US PCE Price Index

Gold price oscillates in a range as the focus remains glued to the US PCE Price Index

Gold price struggles to attract any meaningful buyers amid the emergence of fresh USD buying. Bets that the Fed will keep rates higher for longer amid sticky inflation help revive the USD demand.

Gold News

Sei Price Prediction: SEI is in the zone of interest after a 10% leap

Sei Price Prediction: SEI is in the zone of interest after a 10% leap

Sei price has been in recovery mode for almost ten days now, following a fall of almost 65% beginning in mid-March. While the SEI bulls continue to show strength, the uptrend could prove premature as massive bearish sentiment hovers above the altcoin’s price.

Read more

US core PCE inflation set to signal firm price pressures as markets delay Federal Reserve rate cut bets

US core PCE inflation set to signal firm price pressures as markets delay Federal Reserve rate cut bets

The core PCE Price Index, which excludes volatile food and energy prices, is seen as the more influential measure of inflation in terms of Fed positioning. The index is forecast to rise 0.3% on a monthly basis in March, matching February’s increase. 

Read more

Forex MAJORS

Cryptocurrencies

Signatures