• GBP/USD falls to 1.2772, down 0.20%, following significant losses in global markets.
  • Technicals show bearish momentum; RSI suggests further declines.
  • Key supports: August 2 low at 1.2707, 100-DMA at 1.2683, 200-DMA at 1.2645.
  • For bullish reversal, GBP/USD needs to pass 50-DMA at 1.2786 and August 2 high at 1.2840, aiming for 1.2860 and 1.2900.

The Pound Sterling edges lower after trimming some of its earlier losses due to a bloodbath in the financial markets, led by Asian equities, which triggered circuit breakers halting trading as losses deepened.  The GBP/USD trades at 1.2772, down by 0.20%.

GBP/USD Price Analysis: Technical outlook

Last Friday, the GBP/USD seemed poised to test higher prices, but due to risk aversion and investors seeking safety, the Cable was under pressure during the Asian and European sessions.

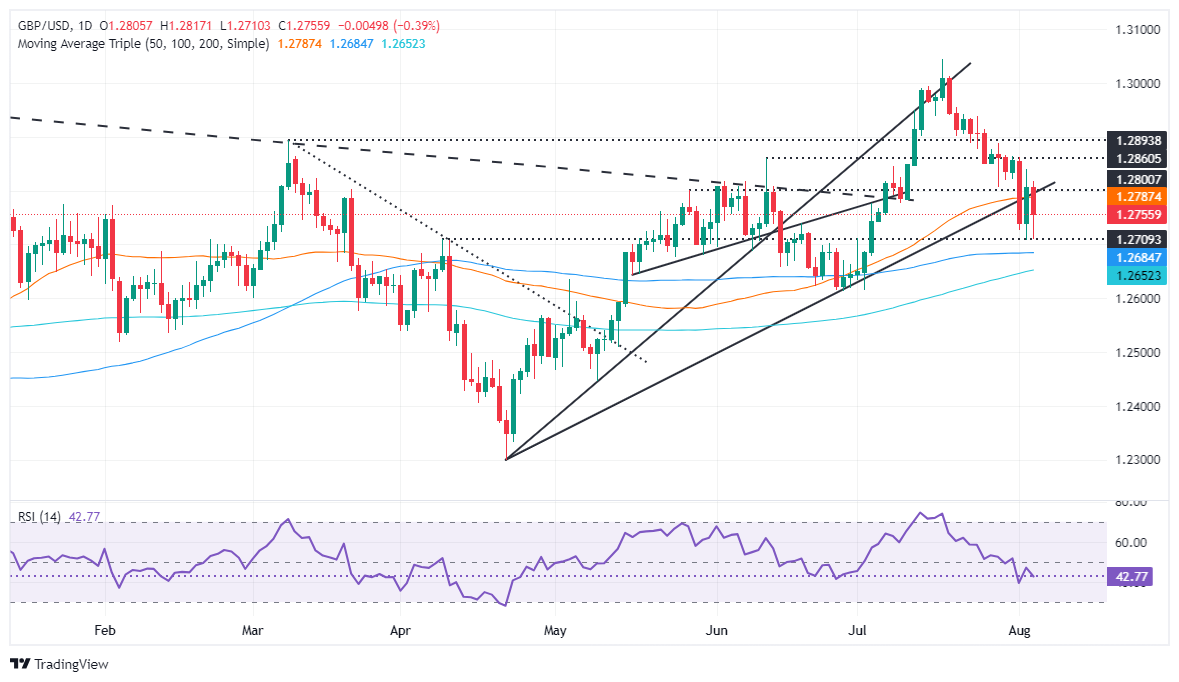
Momentum, as depicted by the Relative Strength Index (RSI), shifted bearishly, and with sellers in charge, further losses loom.

As of writing, the GBP/USD has fallen below 1.2800, and the 50-day moving average (DMA) is at 1.2786, leading for a deeper pullback. If the pair slides below the August 2 low of 1.2707, that could pave the way to test the 100-DMA at 1.2683. A breach of the latter will expose the 200-DMA at 1.2645, which, once broken, would shift and turn the pair bearish.

For a bullish reversal, the GBP/USD must clear the 50-DMA and the August 2 peak at 1.2840. Once hurdle, the next resistance will be the June 12 high at 1.2860, ahead of 1.2900.

GBP/USD Price Action – Daily Chart

British Pound PRICE Today

The table below shows the percentage change of British Pound (GBP) against listed major currencies today. British Pound was the strongest against the Australian Dollar.

  USD EUR GBP JPY CAD AUD NZD CHF
USD   -0.50% 0.38% -2.39% -0.24% 0.43% 0.32% -1.05%
EUR 0.50%   0.80% -2.06% 0.14% 0.95% 0.72% -0.66%
GBP -0.38% -0.80%   -2.77% -0.64% 0.14% -0.08% -1.45%
JPY 2.39% 2.06% 2.77%   2.27% 2.87% 2.83% 1.44%
CAD 0.24% -0.14% 0.64% -2.27%   0.71% 0.56% -0.99%
AUD -0.43% -0.95% -0.14% -2.87% -0.71%   -0.23% -1.59%
NZD -0.32% -0.72% 0.08% -2.83% -0.56% 0.23%   -1.37%
CHF 1.05% 0.66% 1.45% -1.44% 0.99% 1.59% 1.37%  

The heat map shows percentage changes of major currencies against each other. The base currency is picked from the left column, while the quote currency is picked from the top row. For example, if you pick the British Pound from the left column and move along the horizontal line to the US Dollar, the percentage change displayed in the box will represent GBP (base)/USD (quote).


Share: Feed news

Information on these pages contains forward-looking statements that involve risks and uncertainties. Markets and instruments profiled on this page are for informational purposes only and should not in any way come across as a recommendation to buy or sell in these assets. You should do your own thorough research before making any investment decisions. FXStreet does not in any way guarantee that this information is free from mistakes, errors, or material misstatements. It also does not guarantee that this information is of a timely nature. Investing in Open Markets involves a great deal of risk, including the loss of all or a portion of your investment, as well as emotional distress. All risks, losses and costs associated with investing, including total loss of principal, are your responsibility. The views and opinions expressed in this article are those of the authors and do not necessarily reflect the official policy or position of FXStreet nor its advertisers. The author will not be held responsible for information that is found at the end of links posted on this page.

If not otherwise explicitly mentioned in the body of the article, at the time of writing, the author has no position in any stock mentioned in this article and no business relationship with any company mentioned. The author has not received compensation for writing this article, other than from FXStreet.

FXStreet and the author do not provide personalized recommendations. The author makes no representations as to the accuracy, completeness, or suitability of this information. FXStreet and the author will not be liable for any errors, omissions or any losses, injuries or damages arising from this information and its display or use. Errors and omissions excepted.

The author and FXStreet are not registered investment advisors and nothing in this article is intended to be investment advice.

XM
Account
7.2
Tools
9.2
Service
9.4
Trading
9.0
Trust
7.0
Experience
8.4
Read review
Moneta Markets
Account
7.4
Tools
6.6
Service
8.0
Trading
6.6
Trust
5.2
Experience
9.2
Read review
Trading Pro
Account
7.2
Tools
5.2
Service
6.6
Trading
8.0
Trust
5.0
Experience
7.0
Read review
Pepperstone
Account
8.2
Tools
8.2
Service
7.4
Trading
9.0
Trust
8.8
Experience
9.0
Read review
XM
Read review
Moneta Markets
Read review
Trading Pro
Read review
Pepperstone
Read review
Trading Pro
Read review
Pepperstone
Read review
XM
Read review
Moneta Markets
Read review
Trading Pro
Account
7.2
Tools
5.2
Service
6.6
Trading
8.0
Trust
5.0
Experience
7.0
Read review
Pepperstone
Account
8.2
Tools
8.2
Service
7.4
Trading
9.0
Trust
8.8
Experience
9.0
Read review
XM
Account
7.2
Tools
9.2
Service
9.4
Trading
9.0
Trust
7.0
Experience
8.4
Read review
Moneta Markets
Account
7.4
Tools
6.6
Service
8.0
Trading
6.6
Trust
5.2
Experience
9.2
Read review

Recommended content


Recommended content

Editors’ Picks

EUR/USD remains offered in the low-1.0900s

EUR/USD remains offered in the low-1.0900s

The generalised selling pressure continues to weigh on the risk complex, pushing EUR/USD back toward the 1.0900 support level amid a growing risk-off mood, as traders assess President Trump’s reciprocal tariffs and their impact on economic activity.

EUR/USD News
GBP/USD retreats further and breaks below 1.2800

GBP/USD retreats further and breaks below 1.2800

The US Dollar is picking up extra pace and flirting with daily highs, sending GBP/USD to multi-week lows near 1.2770 in a context where safe-haven demand continues to dictate sentiment amid the chaos of US tariffs.

GBP/USD News
Gold slips back below the $3,000 mark

Gold slips back below the $3,000 mark


Gold has turned lower, slipping beneath the key $3,000 mark per troy ounce amid a broad sell-off across global equity markets. The decline in the precious metal may reflect investors unwinding long positions in gold to offset mounting losses in stocks.

Gold News
US stock market suddenly reverses higher after rumor of 90-day tariff pause before sinking again

US stock market suddenly reverses higher after rumor of 90-day tariff pause before sinking again Premium

NASDAQ sinks 4% before shooting higher on tariff pause rumor. CNBC says White House unaware of tariff pause rumor. S&P 500 sinks to January 2024 level. Bank of America cuts its year-end target for S&P 500 by 16%.

Read more
Strategic implications of “Liberation Day”

Strategic implications of “Liberation Day”

Liberation Day in the United States came with extremely protectionist and inward-looking tariff policy aimed at just about all U.S. trading partners. In this report, we outline some of the more strategic implications of Liberation Day and developments we will be paying close attention to going forward.

Read more
The Best brokers to trade EUR/USD

The Best brokers to trade EUR/USD

SPONSORED Discover the top brokers for trading EUR/USD in 2025. Our list features brokers with competitive spreads, fast execution, and powerful platforms. Whether you're a beginner or an expert, find the right partner to navigate the dynamic Forex market.

Read More

Forex MAJORS

Cryptocurrencies

Signatures

Best Brokers of 2025