GBP/USD Price Analysis: Retreats towards 1.2400 within bullish channel as US NFP looms


  • GBP/USD remains pressured after reversing from 10-month high in the last two consecutive days.
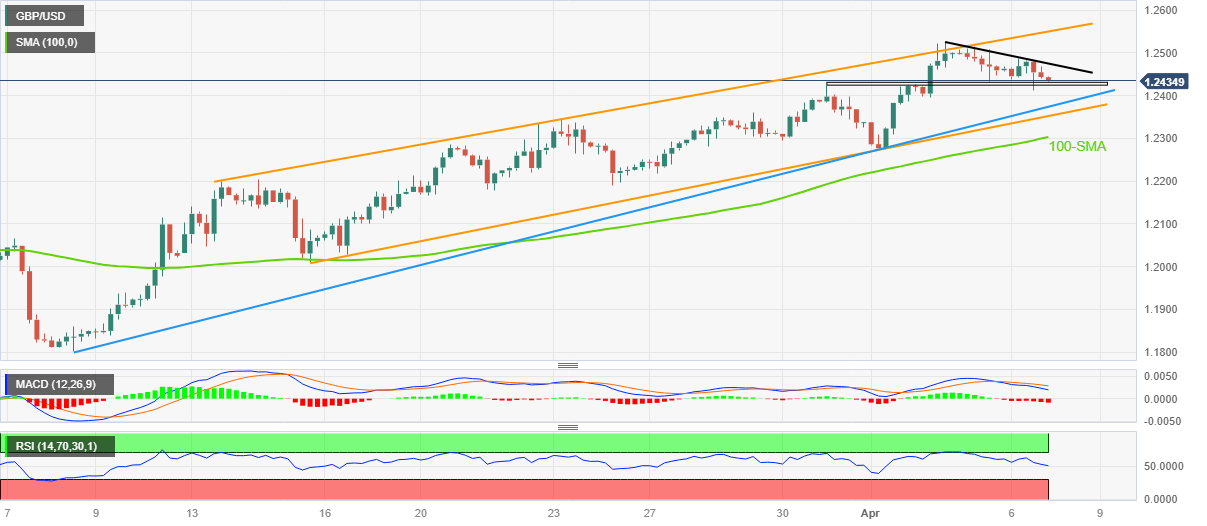
  • One-month-old bullish channel, ascending support line from early March prod Cable bears.
  • MACD, RSI suggests further consolidation of weekly gains ahead of top-tier US employment data.
  • Bulls need validation from 1.2550 to retake control.

GBP/USD drops to 1.2430 as it extends the two-day downtrend to a sluggish Asian session on Good Friday. In doing so, the Cable pair pares the weekly losses, the fourth consecutive one, while easing from the top line of a one-month-old ascending trend channel.

That said, the GBP/USD pair’s pullback from the short-term key hurdle also gains support from bearish MACD signals and the RSI (14) line’s retreat from the overbought territory, which suggests further declines of the quote.

However, a one-week-old horizontal support area around 1.2430 currently restricts the Cable pair’s immediate downside ahead of an upward-sloping support line from March 08, close to 1.2375.

It’s worth noting, though, that the GBP/USD pair’s weakness past 1.2375 will be tough as the stated channel’s lower line and the 100-SMA, respectively near 1.2350 and 1.2300, could challenge the bears before giving them control.

On the contrary, recovery moves need to cross a downward-sloping resistance line from Tuesday, around 1.2475 by the press time.

Even so, the latest multi-month peak of 1.2525, the highest since June 2022, will precede the aforementioned channel’s top line, around 1.2550, to challenge the GBP/USD buyers.

Should the Cable pair remains firmer past 1.2550, backed by price-positive US Nonfarm Payrolls (NFP), the odds of witnessing a run-up to a May 2022 high of around 1.2665 can’t be ruled out.

Also read: Nonfarm Payrolls Preview: Markets fear depressing data, three scenarios for the US Dollar

GBP/USD: Four-hour chart

Trend: Limited downside expected

Additional important levels

Overview
Today last price 1.2438
Today Daily Change -0.0024
Today Daily Change % -0.19%
Today daily open 1.2462
 
Trends
Daily SMA20 1.2248
Daily SMA50 1.2155
Daily SMA100 1.2148
Daily SMA200 1.1899
 
Levels
Previous Daily High 1.2514
Previous Daily Low 1.2433
Previous Weekly High 1.2424
Previous Weekly Low 1.2219
Previous Monthly High 1.2424
Previous Monthly Low 1.1803
Daily Fibonacci 38.2% 1.2464
Daily Fibonacci 61.8% 1.2483
Daily Pivot Point S1 1.2425
Daily Pivot Point S2 1.2388
Daily Pivot Point S3 1.2344
Daily Pivot Point R1 1.2506
Daily Pivot Point R2 1.2551
Daily Pivot Point R3 1.2588


Share: Feed news

Information on these pages contains forward-looking statements that involve risks and uncertainties. Markets and instruments profiled on this page are for informational purposes only and should not in any way come across as a recommendation to buy or sell in these assets. You should do your own thorough research before making any investment decisions. FXStreet does not in any way guarantee that this information is free from mistakes, errors, or material misstatements. It also does not guarantee that this information is of a timely nature. Investing in Open Markets involves a great deal of risk, including the loss of all or a portion of your investment, as well as emotional distress. All risks, losses and costs associated with investing, including total loss of principal, are your responsibility. The views and opinions expressed in this article are those of the authors and do not necessarily reflect the official policy or position of FXStreet nor its advertisers. The author will not be held responsible for information that is found at the end of links posted on this page.

If not otherwise explicitly mentioned in the body of the article, at the time of writing, the author has no position in any stock mentioned in this article and no business relationship with any company mentioned. The author has not received compensation for writing this article, other than from FXStreet.

FXStreet and the author do not provide personalized recommendations. The author makes no representations as to the accuracy, completeness, or suitability of this information. FXStreet and the author will not be liable for any errors, omissions or any losses, injuries or damages arising from this information and its display or use. Errors and omissions excepted.

The author and FXStreet are not registered investment advisors and nothing in this article is intended to be investment advice.

Recommended content


Recommended content

Editors’ Picks

EUR/USD sticks to recovery gains above 1.1500 amid US Dollar pullback

EUR/USD sticks to recovery gains above 1.1500 amid US Dollar pullback

EUR/USD holds its winning streak for the third successive day, holding firm above 1.1500 in the European session on Friday. The pair recovers as the US Dollar loses ground, possibly driven by a technical pullback and receding fears over a likely US military attack on Iran. Geopolitics remain in focus. 

GBP/USD holds the rebound near 1.3500 despite weak UK Retail Sales data

GBP/USD holds the rebound near 1.3500 despite weak UK Retail Sales data

GBP/USD has found demand and retakes 1.3500 in European trading on Friday. The pair seems to have ignored the downbeat UK Retail Sales data for May. Broad US Dollar weakness, amid easing Middle East tensions, keeps the major underpinned. 

Gold price struggles near weekly low amid fewer Fed rate cut bets, despite Middle East tensions

Gold price struggles near weekly low amid fewer Fed rate cut bets, despite Middle East tensions

Gold price is seen consolidating its intraday losses to over a one-week low and trades just below the $3,350 level during the first half of the European session. The US Federal Reserve earlier this week trimmed the outlook for rate cuts in 2026 and 2027, which is seen acting as a tailwind for the US Dollar and undermining demand for the non-yielding yellow metal.

Shiba Inu Price Forecast: SHIB demand wanes as holders offload meme tokens 

Shiba Inu Price Forecast: SHIB demand wanes as holders offload meme tokens 

Shiba Inu (SHIB) extends its decline at the time of writing on Friday after dropping nearly 5% so far this week. The on-chain data supports a correction ahead, as SHIB holders are unloading tokens amid the escalating Iran-Israel war.

In the Eurozone, inflation is also a monetary phenomenon

In the Eurozone, inflation is also a monetary phenomenon

Monetary aggregates continue to be closely monitored by the European Central Bank (ECB), a sign that, despite the passage of time and the increasing complexity of financing circuits, quantitative theory remains relevant. 

The Best brokers to trade EUR/USD

The Best brokers to trade EUR/USD

SPONSORED Discover the top brokers for trading EUR/USD in 2025. Our list features brokers with competitive spreads, fast execution, and powerful platforms. Whether you're a beginner or an expert, find the right partner to navigate the dynamic Forex market.

Forex MAJORS

Cryptocurrencies

Signatures

Best Brokers of 2025