|

GBP/USD Price Analysis: Refreshes multi-month tops and retreats, back below 1.4200

  • GBP/USD added to the overnight strong move up and gained traction for the second straight day.
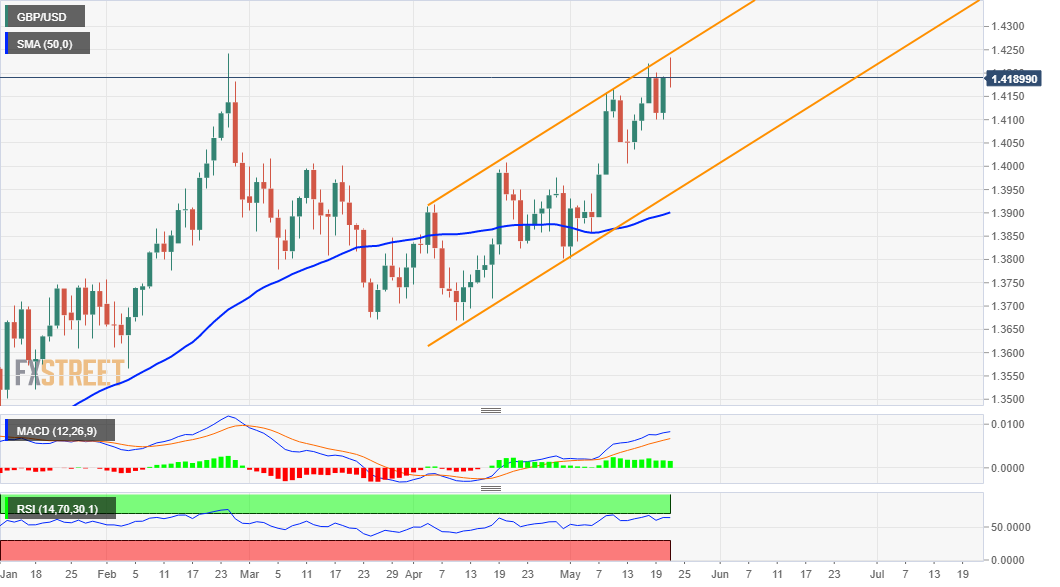
  • The intraday uptick stalled near a resistance marked by the top end of an ascending trend channel.
  • The set-up seems titled in favour of bullish traders and supports prospects for an eventual breakout.

The GBP/USD pair shot to fresh three-month tops during the mid-European session, albeit quickly retreated few pips thereafter. The pair was last seen trading just below the 1.4200 mark, nearly unchanged for the day.

Following a brief consolidation through the first part of the trading action on Friday, the pair turned positive for the second consecutive session and built on the overnight strong move up. The US dollar struggled to gain any meaningful traction and languished near multi-month lows. This, along with mostly upbeat UK macro data, provided a modest lift to the GBP/USD pair.

Looking at the technical picture, the intraday uptick stalled near a resistance marked by the top boundary of a short-term ascending channel extending from lows touched in March and April. The mentioned barrier, currently around the 1.4235 region, coincides with YTD tops touched on February 24. This, in turn, should now act as a key pivotal point for short-term traders.

Meanwhile, technical indicators on the daily chart maintained their bullish bias and are still far from being in the overbought territory. The technical set-up seems tilted firmly in favour of bullish traders and supports prospects for an eventual breakout to the upside. That said, bulls might still wait for a sustained move beyond the 1.4235 area before placing fresh bets.

The GBP/USD pair might then aim to reclaim the 1.4300 round-figure mark and prolong the upward trajectory further towards 2018 yearly tops, around the 1.4375 region.

On the flip side, the daily swing lows, around the 1.4170-65 region now seems to protect the immediate downside. Sustained weakness below might turn the GBP/USD pair vulnerable to accelerate the fall back towards the 1.4100 mark. This is followed by weekly lows, around the 1.4075 region, which if broken will negate the constructive outlook and prompt some technical selling.

GBP/USD daily chart

fxsoriginal

Technical levels to watch

GBP/USD

Overview
Today last price1.4209
Today Daily Change0.0018
Today Daily Change %0.13
Today daily open1.4191
 
Trends
Daily SMA201.4003
Daily SMA501.3896
Daily SMA1001.3838
Daily SMA2001.3497
 
Levels
Previous Daily High1.4193
Previous Daily Low1.4101
Previous Weekly High1.4166
Previous Weekly Low1.3982
Previous Monthly High1.4009
Previous Monthly Low1.3669
Daily Fibonacci 38.2%1.4158
Daily Fibonacci 61.8%1.4136
Daily Pivot Point S11.413
Daily Pivot Point S21.407
Daily Pivot Point S31.4039
Daily Pivot Point R11.4222
Daily Pivot Point R21.4253
Daily Pivot Point R31.4313

Author

Haresh Menghani

Haresh Menghani is a detail-oriented professional with 10+ years of extensive experience in analysing the global financial markets.

More from Haresh Menghani
Share:

Markets move fast. We move first.

Orange Juice Newsletter brings you expert driven insights - not headlines. Every day on your inbox.

By subscribing you agree to our Terms and conditions.

Editor's Picks

EUR/USD extends slide below 1.1700

The EUR/USD pair nears its weekly low at around 1.1660 in the American session on Tuesday, retreating from the 1.1750 price zone tested earlier in the day. Cautiously optimistic markets support the US Dollar in the near term.

GBP/USD consolidates around 1.3500; looks to US macro data for fresh impetus

The GBP/USD pair oscillates in a narrow range, around the 1.3500 psychological mark during the Asian session on Wednesday, and for now, seems to have stalled the previous day's retracement slide from its highest level since September 18. Moreover, the fundamental backdrop seems tilted in favor of bullish traders and suggests that the path of least resistance for spot prices is to the upside.

Gold extends upside to near $4,500 on Venezuela turmoil

Gold price climbs to near $4,500 during the early Asian trading hours on Wednesday. The precious metal rises by more than 1% in the day as geopolitical tensions and expectations of US rate cuts keep demand for gold high. The US ISM Services Purchasing Managers Index report will be published on Wednesday. 

Pump.fun prepares for early-year rally as DEX volume skyrockets

Pump.fun (PUMP) is rising alongside crypto majors such as Bitcoin (BTC) and is trading above $0.002400 at the time of writing on Tuesday. The Decentralized Exchange (DEX) native token outlook builds on a bullish tone developed since December 30.

Implications of US intervention in Venezuela

Events in Venezuela are top of mind for market participants, and while developments are associated with an elevated degree of uncertainty, we are not making any changes to our markets or economic forecasts as a result of the deposition of Nicolás Maduro. 

Cardano holds steady as bulls intensify push for breakout

Cardano rises above the 50-day EMA resistance amid a risk-on mood across the crypto market. The MACD upholds positive divergence, increasing the potential for a 20% breakout to $0.505.