|

GBP/USD Price Analysis: Bounces off 78.6% Fibonacci ratio, focus on 1.2530 support-turned-resistance

  • GBP/USD licks its wounds at three-month low, consolidating recent losses from 78.6% Fibonacci ratio.
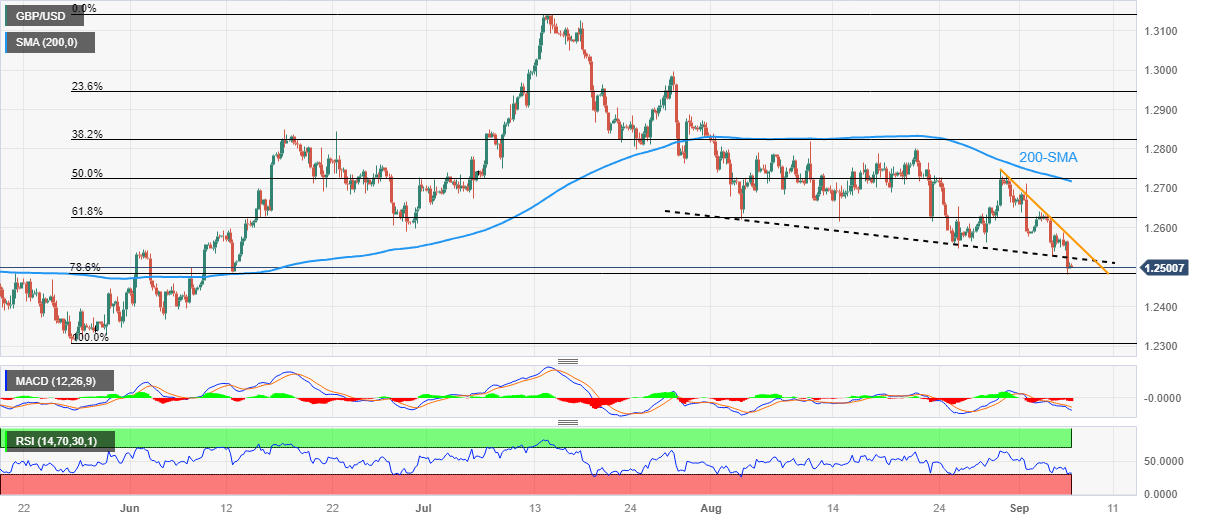
  • Oversold RSI adds strength to corrective bounce toward previous support line from early August.
  • 200-SMA holds the key to Pound Sterling buyer’s conviction.

GBP/USD portrays a corrective bounce off a three-month low to around 1.2500 amid early Thursday morning in Asia. In doing so, the Cable pair justifies the oversold RSI conditions, as well as the Pound Sterling’s sustained rebound from the 78.6% Fibonacci retracement of late May to mid-March upside, near 1.2485.

Even so, the bearish MACD signals and the support-turned-resistance stretched from early August guard immediate recovery of the Pound Sterling pair around 1.2530.

Following that, a one-week-old descending resistance line surrounding 1.2580 will precede the 200-SMA hurdle of around 1.2720 to act as the final defense of the GBP/USD pair sellers.

Alternatively, a daily closing beneath the 78.6% Fibonacci retracement level of 1.2485 could quickly drag the GBP/USD pair’s low marked in June around 1.2370, a break of which will direct the Cable bears toward the yearly low marked in March around 1.1800.

That said, the 1.2000 psychological magnet acts as the intermediate halt between 1.2370 and 1.1800.

Overall, the GBP/USD pair is likely to witness a corrective bounce but the room towards the north is long and bumpy.

On a fundamental side, comparatively more hawkish Federal Reserve (Fed) talks than their Bank of England (BoE) counterparts keep exerting downside pressure on the GBP/USD despite the latest corrective bounce.

GBP/USD: Four-hour chart

Trend: Limited recovery expected

Additional important levels

Overview
Today last price1.2501
Today Daily Change-0.0063
Today Daily Change %-0.50%
Today daily open1.2564
 
Trends
Daily SMA201.2675
Daily SMA501.2771
Daily SMA1001.2654
Daily SMA2001.2422
 
Levels
Previous Daily High1.2632
Previous Daily Low1.2528
Previous Weekly High1.2746
Previous Weekly Low1.2563
Previous Monthly High1.2841
Previous Monthly Low1.2548
Daily Fibonacci 38.2%1.2568
Daily Fibonacci 61.8%1.2592
Daily Pivot Point S11.2518
Daily Pivot Point S21.2471
Daily Pivot Point S31.2414
Daily Pivot Point R11.2621
Daily Pivot Point R21.2678
Daily Pivot Point R31.2725

Author

Anil Panchal

Anil Panchal

FXStreet

Anil Panchal has nearly 15 years of experience in tracking financial markets. With a keen interest in macroeconomics, Anil aptly tracks global news/updates and stays well-informed about the global financial moves and their implications.

More from Anil Panchal
Share:

Markets move fast. We move first.

Orange Juice Newsletter brings you expert driven insights - not headlines. Every day on your inbox.

By subscribing you agree to our Terms and conditions.

Editor's Picks

EUR/USD could test 1.1750 amid strengthening bullish bias

EUR/USD remains flat after two days of small losses, trading around 1.1740 during the Asian hours on Thursday. On the daily chart, technical analysis indicates a strengthening of a bullish bias, as the pair continues to trade within an ascending channel pattern.

GBP/USD consolidates above mid-1.3300s as traders await BoE and US CPI report

The GBP/USD pair struggles to capitalize on the overnight bounce from the 1.3310 area, or a one-week low, and oscillates in a narrow band during the Asian session on Thursday. Spot prices currently trade around the 1.3370 region, down less than 0.10% for the day, as traders opt to wait on the sidelines ahead of the key central bank event risk and US consumer inflation data.

Gold awaits weekly trading range breakout ahead of US CPI report

Gold struggles to capitalize on the previous day's move higher back closer to the $4,350 level and trades with a mild negative bias during the Asian session on Thursday. The downtick could be attributed to some profit-taking amid a US Dollar uptick, though it is likely to remain cushioned on the back of a supportive fundamental backdrop. 

Dogecoin breaks key support amid declining investor confidence

Dogecoin trades in the red on Thursday, following a 4% decline on the previous day. The DOGE supply in profit declines as large wallet investors trim their portfolios. Derivatives data shows a surge in bearish positions amid declining retail interest.

Monetary policy: Three central banks, three decisions, the same caution

While the Fed eased its monetary policy on 10 December for the third consecutive FOMC meeting, without making any guarantees about future action, the BoE, the ECB and the BoJ are holding their respective meetings this week. 

Dogecoin Price Forecast: DOGE breaks key support amid declining investor confidence

Dogecoin (DOGE) trades in the red on Thursday, following a 4% decline on the previous day. The DOGE supply in profit declines as large wallet investors trim their portfolios. Derivatives data shows a surge in bearish positions amid declining retail interest.