GBP/USD Price Analysis: Pound plummets, targets 1.2600 as evening star surfaces
- GBP/USD declines after struggling at 1.2700, following weak US housing data and strong USD.
- Technical outlook shows bearish momentum with an 'evening star' pattern and RSI indicating further downside.
- Key support levels are the 50-DMA at 1.2636, 1.2600, and 200-DMA at 1.2555.
- For a bullish reversal, GBP/USD needs to surpass 1.2700 and clear resistance at 1.2730/40.

The Pound Sterling lost ground versus the Greenback on Wednesday following the release of US housing data, which highlights the sector's weakness, yet the buck trades at around 8-week highs, as shown by the US Dollar Index (DXY). The GBP/USD trades at 1.2642, down 0.34%.
GBP/USD Price Analysis: Technical outlook
In Tuesday’s article, I wrote, “The pair formed a ‘bullish piercing’ pattern, hinting that traders could challenge the next resistance seen at 1.2700, yet buyers remain reluctant to lift the GBP/USD towards that level.”
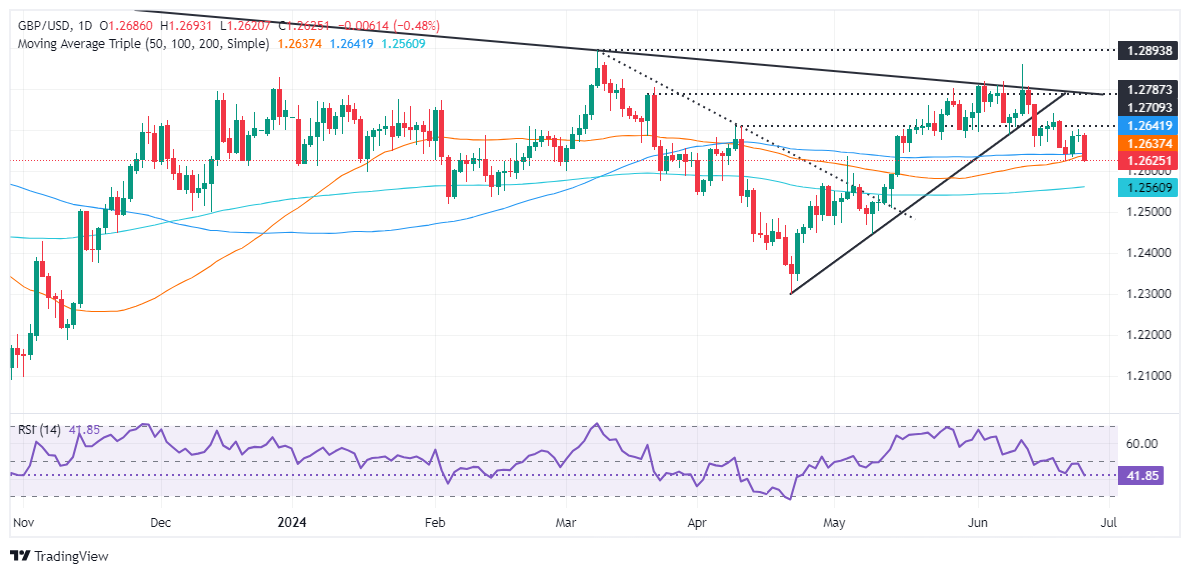
The GBP/USD was unable to reach 1.2700 and has broken below Tuesday’s low of 1.2670, printing a new weekly low of 1.2627, after a three-candlestick chart pattern ‘evening star’ emerged.
Momentum supports sellers, as shown by the Relative Strength Index (RSI), which remains bearish and aims lower.
Therefore, the GBP/USD path of least resistance is downwards. It will face the next support level at the 50-DMA at 1.2636. Once that area is surpassed, the psychological 1.2600 mark will follow, ahead of the 200-DMA at 1.2555.
For a bullish continuation, traders must claim 1.2700 and clear a previous support trendline turned resistance at around 1.2730/40.
GBP/USD Price Action – Daily Chart
British Pound PRICE Today
The table below shows the percentage change of British Pound (GBP) against listed major currencies today. British Pound was the strongest against the New Zealand Dollar.
| USD | EUR | GBP | JPY | CAD | AUD | NZD | CHF | |
|---|---|---|---|---|---|---|---|---|
| USD | 0.30% | 0.47% | 0.59% | 0.25% | -0.06% | 0.58% | 0.29% | |
| EUR | -0.30% | 0.16% | 0.27% | -0.08% | -0.35% | 0.29% | -0.01% | |
| GBP | -0.47% | -0.16% | 0.10% | -0.23% | -0.52% | 0.15% | -0.21% | |
| JPY | -0.59% | -0.27% | -0.10% | -0.34% | -0.65% | 0.01% | -0.32% | |
| CAD | -0.25% | 0.08% | 0.23% | 0.34% | -0.34% | 0.35% | 0.02% | |
| AUD | 0.06% | 0.35% | 0.52% | 0.65% | 0.34% | 0.65% | 0.35% | |
| NZD | -0.58% | -0.29% | -0.15% | -0.01% | -0.35% | -0.65% | -0.33% | |
| CHF | -0.29% | 0.01% | 0.21% | 0.32% | -0.02% | -0.35% | 0.33% |
The heat map shows percentage changes of major currencies against each other. The base currency is picked from the left column, while the quote currency is picked from the top row. For example, if you pick the British Pound from the left column and move along the horizontal line to the US Dollar, the percentage change displayed in the box will represent GBP (base)/USD (quote).
Author

Christian Borjon Valencia
FXStreet
Markets analyst, news editor, and trading instructor with over 14 years of experience across FX, commodities, US equity indices, and global macro markets.


