• GBP/USD climbs past 100-DMA, with buyers gaining traction.
  • Buying interest remains strong, as RSI points upwards, yet to become overbought.
  • Key resistance lies at 1.2670, which would exacerbate followed by 1.2700.
  • Sellers target a close below the 100-DMA to challenge 1.2600.

The Pound Sterling advanced some 0.30% and hit a five-week high of 1.2670 following the release of the US Consumer Price Index (CPI). The data was mostly aligned with estimates, showing a continuation of the disinflation process, which weighed on the Greenback. The GBP/USD trades at 1.2641 at the time of writing.

GBP/USD Price Analysis: Technical outlook

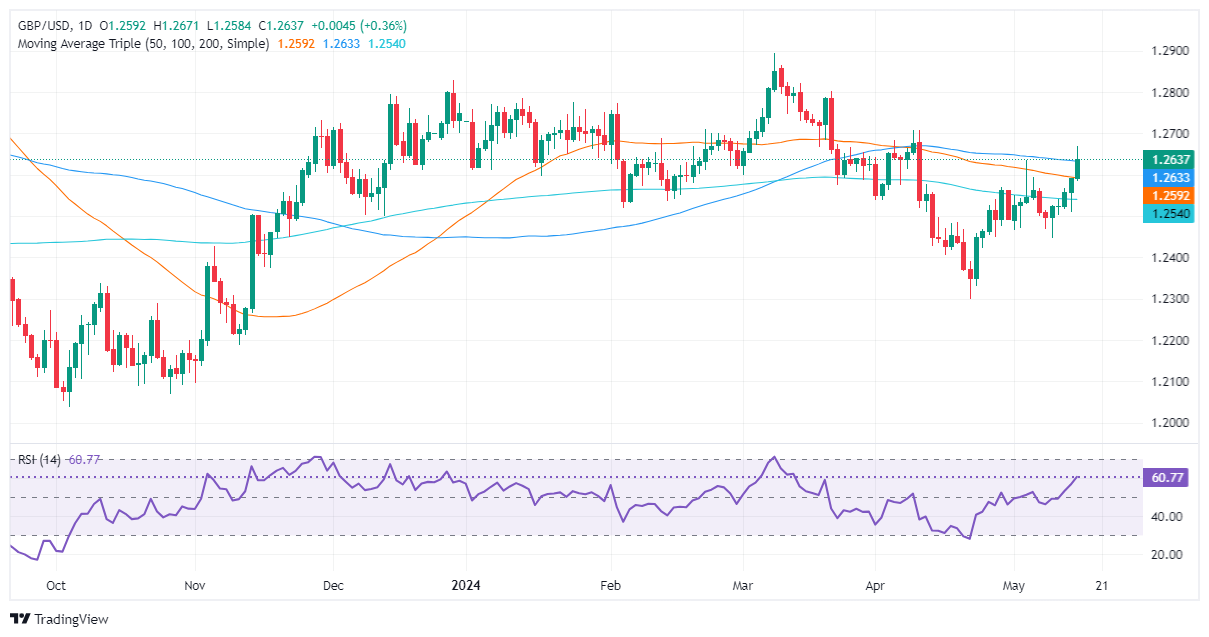
The GBP/USD remains neutral to upward bias and hit a weekly high at 1.2670 following a soft US inflation report. However, the pair has retreated toward the 100-day moving average (DMA) at 1.2632, seen as the next key technical level that, once surpassed, could pave the way for further gains.

The Relative Strength Index (RSI) shows that momentum favors buyers. The RSI aims upward with enough room before portraying overbought conditions.

If buyers reclaim the 100-DMA, the next resistance would be today’s high at 1.2670. A breach of the latter will expose the April 9 high at 1.2709, ahead of rallying to the next supply zone at 1.2803, the March 21 high. Once surpassed, the next stop would be the year-to-date (YTD) high at 1.2894.

Conversely, sellers remain hopeful that the GBP/USD exchange rate could tumble below the 100-DMA and achieve a daily close below that level, to challenge 1.2600. Once cleared, the next stop would be the 50-DMa at 1.2591, followed by the 200-DMA at 1.2539.

GBP/USD Price Action – Daily Chart

GBP/USD

Overview
Today last price 1.2632
Today Daily Change 0.0040
Today Daily Change % 0.32
Today daily open 1.2592
 
Trends
Daily SMA20 1.2498
Daily SMA50 1.2594
Daily SMA100 1.2634
Daily SMA200 1.2541
 
Levels
Previous Daily High 1.2593
Previous Daily Low 1.2509
Previous Weekly High 1.2594
Previous Weekly Low 1.2446
Previous Monthly High 1.2709
Previous Monthly Low 1.23
Daily Fibonacci 38.2% 1.2561
Daily Fibonacci 61.8% 1.2541
Daily Pivot Point S1 1.2537
Daily Pivot Point S2 1.2481
Daily Pivot Point S3 1.2453
Daily Pivot Point R1 1.262
Daily Pivot Point R2 1.2648
Daily Pivot Point R3 1.2704


Share: Feed news

Information on these pages contains forward-looking statements that involve risks and uncertainties. Markets and instruments profiled on this page are for informational purposes only and should not in any way come across as a recommendation to buy or sell in these assets. You should do your own thorough research before making any investment decisions. FXStreet does not in any way guarantee that this information is free from mistakes, errors, or material misstatements. It also does not guarantee that this information is of a timely nature. Investing in Open Markets involves a great deal of risk, including the loss of all or a portion of your investment, as well as emotional distress. All risks, losses and costs associated with investing, including total loss of principal, are your responsibility. The views and opinions expressed in this article are those of the authors and do not necessarily reflect the official policy or position of FXStreet nor its advertisers. The author will not be held responsible for information that is found at the end of links posted on this page.

If not otherwise explicitly mentioned in the body of the article, at the time of writing, the author has no position in any stock mentioned in this article and no business relationship with any company mentioned. The author has not received compensation for writing this article, other than from FXStreet.

FXStreet and the author do not provide personalized recommendations. The author makes no representations as to the accuracy, completeness, or suitability of this information. FXStreet and the author will not be liable for any errors, omissions or any losses, injuries or damages arising from this information and its display or use. Errors and omissions excepted.

The author and FXStreet are not registered investment advisors and nothing in this article is intended to be investment advice.

Recommended content


Recommended content

Editors’ Picks

EUR/USD stays in positive territory above 1.0850 after US data

EUR/USD stays in positive territory above 1.0850 after US data

EUR/USD clings to modest daily gains above 1.0850 in the second half of the day on Friday. The improving risk mood makes it difficult for the US Dollar to hold its ground after PCE inflation data, helping the pair edge higher ahead of the weekend.

EUR/USD News

GBP/USD stabilizes above 1.2850 as risk mood improves

GBP/USD stabilizes above 1.2850 as risk mood improves

GBP/USD maintains recovery momentum and fluctuates above 1.2850 in the American session on Friday. The positive shift seen in risk mood doesn't allow the US Dollar to preserve its strength and supports the pair.

GBP/USD News

Gold rebounds above $2,380 as US yields stretch lower

Gold rebounds above $2,380 as US yields stretch lower

Following a quiet European session, Gold gathers bullish momentum and trades decisively higher on the day above $2,380. The benchmark 10-year US Treasury bond yield loses more than 1% on the day after US PCE inflation data, fuelling XAU/USD's upside.

Gold News

Avalanche price sets for a rally following retest of key support level

Avalanche price sets for a rally following retest of  key support level

Avalanche (AVAX) price bounced off the $26.34 support level to trade at $27.95 as of Friday. Growing on-chain development activity indicates a potential bullish move in the coming days.

Read more

The election, Trump's Dollar policy, and the future of the Yen

The election, Trump's Dollar policy, and the future of the Yen

After an assassination attempt on former President Donald Trump and drop out of President Biden, Kamala Harris has been endorsed as the Democratic candidate to compete against Trump in the upcoming November US presidential election.

Read more

Forex MAJORS

Cryptocurrencies

Signatures