GBP/USD Price Analysis: Oscillates above 1.2500 as US PMI contraction vs. solid Employment divides Fed


  • GBP/USD is juggling in a narrow range above 1.2500 ahead of the US NFP data.
  • Fed policymakers are divided over contracting US Manufacturing PMI vs. tight labor market conditions.
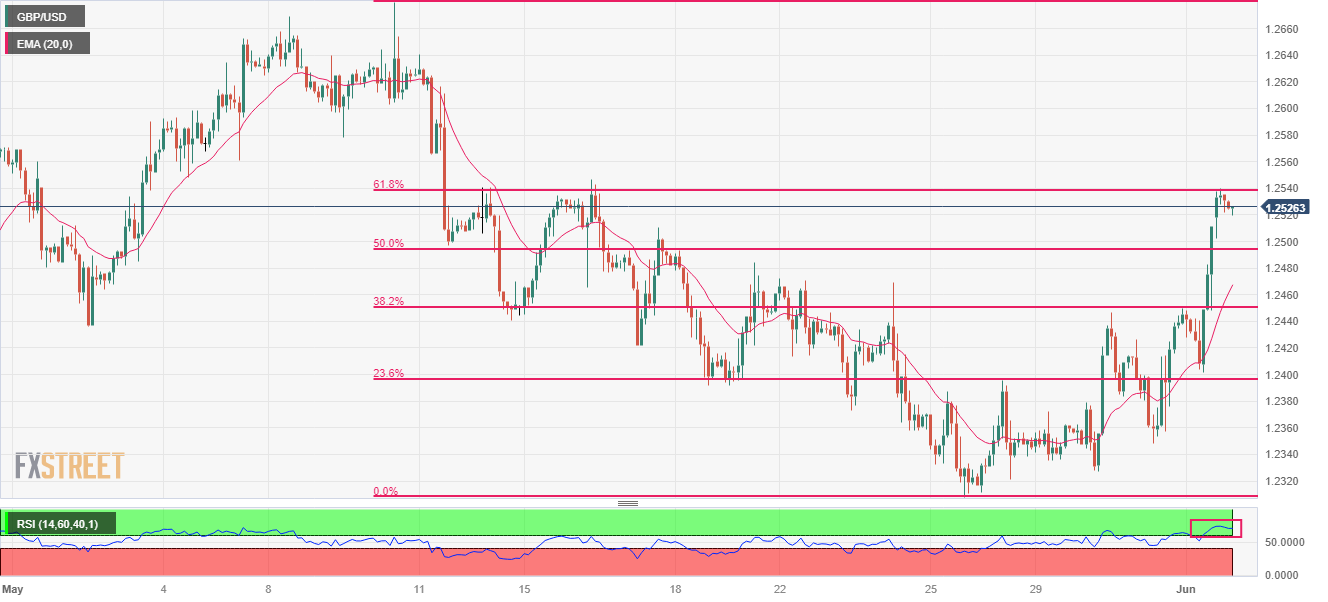
  • GBP/USD is gathering strength for a breakout above the 61.8% Fibo retracement at 1.2539.

The GBP/USD pair is oscillating after a stalwart rally above the psychological resistance of 1.2500 in the early Tokyo session. The Cable has turned sideways as investors are confused that whether Federal Reserve (Fed) policymakers will focus on consistently contracting United States ISM Manufacturing PMI or tight labor market conditions while designing the monetary policy for June month.

On Thursday, the US ISM reported a seventh straight contraction in US factory activity due to higher interest rates while the Automatic Data Processing (ADP) agency reported an addition of 278K fresh payrolls against the consensus of 170K.

The US Dollar Index (DXY) showed a vertical fall after surrendering the crucial support of 104.00 and has now extended its downside below 103.60, at the time of writing.

GBP/USD is gathering strength for a breakout above the 61.8% Fibonacci retracement (plotted from May 10 high at 1.2680 to May 25 low at 1.2308) at 1.2539 on a two-hour scale.

Upward-sloping 20-period Exponential Moving Average (EMA) at 1.2468 indicates that the short-term trend is extremely bullish.

Also, the Relative Strength Index (RSI) (14) is oscillating in the bullish range of 60.00-80.00, which signals the bullish momentum has already been triggered.

For further upside, a confident break above May 16 high at 1.2547 will drive the Cable toward May 10 low at 1.2603 followed by May 10 high at 1.2680.

On the flip side, a breakdown below May 12 low at 1.2440 will drag the asset toward a 23.6% Fibo retracement near 1.2400 and May 31 low at 1.2348.

GBP/USD two-hour chart

GBP/USD

Overview
Today last price 1.2526
Today Daily Change 0.0086
Today Daily Change % 0.69
Today daily open 1.244
 
Trends
Daily SMA20 1.2474
Daily SMA50 1.2444
Daily SMA100 1.2295
Daily SMA200 1.1987
 
Levels
Previous Daily High 1.2444
Previous Daily Low 1.2348
Previous Weekly High 1.2472
Previous Weekly Low 1.2308
Previous Monthly High 1.268
Previous Monthly Low 1.2308
Daily Fibonacci 38.2% 1.2408
Daily Fibonacci 61.8% 1.2385
Daily Pivot Point S1 1.2377
Daily Pivot Point S2 1.2315
Daily Pivot Point S3 1.2281
Daily Pivot Point R1 1.2474
Daily Pivot Point R2 1.2507
Daily Pivot Point R3 1.257


Share: Feed news

Information on these pages contains forward-looking statements that involve risks and uncertainties. Markets and instruments profiled on this page are for informational purposes only and should not in any way come across as a recommendation to buy or sell in these assets. You should do your own thorough research before making any investment decisions. FXStreet does not in any way guarantee that this information is free from mistakes, errors, or material misstatements. It also does not guarantee that this information is of a timely nature. Investing in Open Markets involves a great deal of risk, including the loss of all or a portion of your investment, as well as emotional distress. All risks, losses and costs associated with investing, including total loss of principal, are your responsibility. The views and opinions expressed in this article are those of the authors and do not necessarily reflect the official policy or position of FXStreet nor its advertisers. The author will not be held responsible for information that is found at the end of links posted on this page.

If not otherwise explicitly mentioned in the body of the article, at the time of writing, the author has no position in any stock mentioned in this article and no business relationship with any company mentioned. The author has not received compensation for writing this article, other than from FXStreet.

FXStreet and the author do not provide personalized recommendations. The author makes no representations as to the accuracy, completeness, or suitability of this information. FXStreet and the author will not be liable for any errors, omissions or any losses, injuries or damages arising from this information and its display or use. Errors and omissions excepted.

The author and FXStreet are not registered investment advisors and nothing in this article is intended to be investment advice.

Recommended content


Recommended content

Editors’ Picks

USD/JPY jumps above 156.00 on BoJ's steady policy

USD/JPY jumps above 156.00 on BoJ's steady policy

USD/JPY has come under intense buying pressure, surging past 156.00 after the Bank of Japan kept the key rate unchanged but tweaked its policy statement. The BoJ maintained its fiscal year 2024 and 2025 inflation forecast, disappointing the Japanese Yen buyers. 

USD/JPY News

AUD/USD consolidates gains above 0.6500 after Australian PPI data

AUD/USD consolidates gains above 0.6500 after Australian PPI data

AUD/USD is consolidating gains above 0.6500 in Asian trading on Friday. The pair capitalizes on an annual increase in Australian PPI data. Meanwhile, a softer US Dollar and improving market mood also underpin the Aussie ahead of the US PCE inflation data. 

AUD/USD News

Gold price keeps its range around $2,330, awaits US PCE data

Gold price keeps its range around $2,330, awaits US PCE data

Gold price is consolidating Thursday's rebound early Friday. Gold price jumped after US GDP figures for the first quarter of 2024 missed estimates, increasing speculation that the Fed could lower borrowing costs. Focus shifts to US PCE inflation on Friday. 

Gold News

Stripe looks to bring back crypto payments as stablecoin market cap hits all-time high

Stripe looks to bring back crypto payments as stablecoin market cap hits all-time high

Stripe announced on Thursday that it would add support for USDC stablecoin, as the stablecoin market exploded in March, according to reports by Cryptocompare.

Read more

US economy: Slower growth with stronger inflation

US economy: Slower growth with stronger inflation

The US Dollar strengthened, and stocks fell after statistical data from the US. The focus was on the preliminary estimate of GDP for the first quarter. Annualised quarterly growth came in at just 1.6%, down from the 2.5% and 3.4% previously forecast.

Read more

Forex MAJORS

Cryptocurrencies

Signatures