|

GBP/USD Price Analysis: Needs to find acceptance above 1.2800 for bulls to seize control

  • GBP/USD remains under some selling pressure on Friday, though lacks follow-through.
  • The uncertainty over the Fed’s rate-cut path should cap the USD and offer support. 
  • The mixed technical setup further warrants caution before placing directional bets.

The GBP/USD pair trades with a negative bias for the second straight day on Friday, albeit manages to hold its neck above the previous day's swing low. Spot prices currently hover around the mid-1.2700s and seem poised to register modest weekly gains amid subdued US Dollar (USD) price action. 

Against the backdrop of the Federal Reserve's (Fed) hawkish stance, the emergence of fresh selling around the Japanese Yen (JPY), triggered by the Bank of Japan's (BoJ) inaction, lends some support to the USD and weighs on the GBP/USD pair. That said, signs of easing inflationary pressures in the US keep hopes alive for a September Fed rate cut, which should cap the USD and act as a tailwind for the currency pair. 

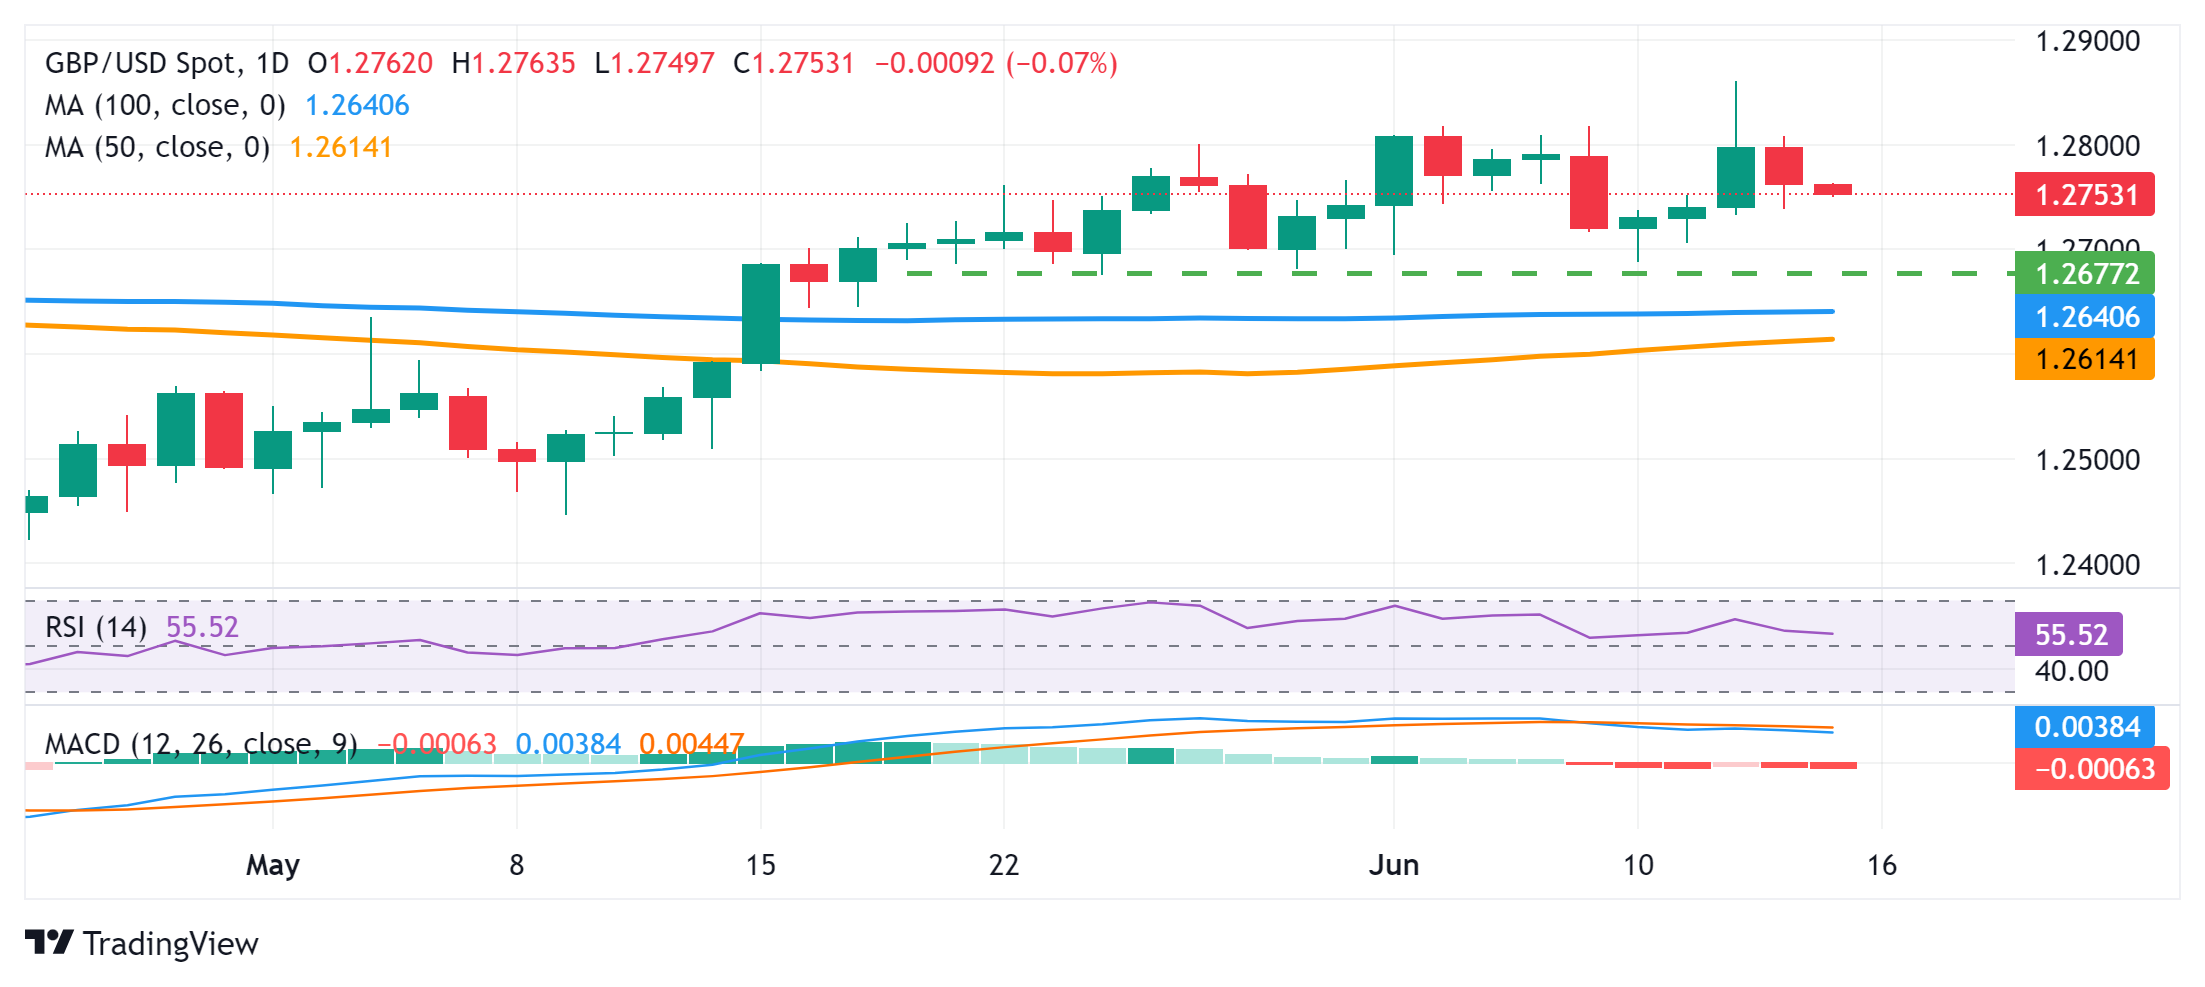
From a technical perspective, the recent repeated failures to find acceptance above the 1.2800 mark and the subsequent downfall warrant caution for the GBP/USD bulls ahead of the UK national election on July 4. Meanwhile, mixed oscillators on the daily chart further make it prudent to wait for strong follow-through selling before confirming that the recent strong rally from the YTD trough touched in April has run its course.

Hence, any further decline is likely to find decent support near the 1.2755-1.2750 horizontal zone, below which the GBP/USD pair could slide to the 1.2715-1.2710 region. The downfall could extend further towards the 1.2690-1.2685 region en route to the 100-day Simple Moving Average (SMA), currently near the 1.2640-1.2635 area. A convincing break below the latter will mark a bearish breakdown and pave the way for deeper losses.

On the flip side, bulls need to wait for sustained strength and acceptance above the 1.2800 mark before positioning for a move back towards the 1.2860 area, or over a three-month high touched on Wednesday. A sustained strength beyond should allow the GBP/USD pair to surpass the YTD peak, around the 1.2900 neighborhood, and the 1.2950 resistance, towards reclaiming the 1.3000 psychological mark for the first time since July 2023.

GBP/USD daily chart

fxsoriginal

GBP/USD

Overview
Today last price1.2753
Today Daily Change-0.0009
Today Daily Change %-0.07
Today daily open1.2762
 
Trends
Daily SMA201.2744
Daily SMA501.2612
Daily SMA1001.264
Daily SMA2001.255
 
Levels
Previous Daily High1.2808
Previous Daily Low1.2738
Previous Weekly High1.2818
Previous Weekly Low1.2695
Previous Monthly High1.2801
Previous Monthly Low1.2446
Daily Fibonacci 38.2%1.2765
Daily Fibonacci 61.8%1.2781
Daily Pivot Point S11.2731
Daily Pivot Point S21.27
Daily Pivot Point S31.2662
Daily Pivot Point R11.2801
Daily Pivot Point R21.2839
Daily Pivot Point R31.287

Author

Haresh Menghani

Haresh Menghani is a detail-oriented professional with 10+ years of extensive experience in analysing the global financial markets.

More from Haresh Menghani
Share:

Markets move fast. We move first.

Orange Juice Newsletter brings you expert driven insights - not headlines. Every day on your inbox.

By subscribing you agree to our Terms and conditions.

Editor's Picks

EUR/USD posts modest gains above 1.1700 as ECB signals pause

The EUR/USD pair posts modest gains around 1.1710 during the early Asian session on Monday. The Euro strengthens against the Greenback after the European Central Bank left its policy rates unchanged and took a more positive view on the Eurozone economy, which has shown resilience to global trade shocks. Financial markets are likely to remain subdued as traders book profits ahead of the long holiday period.

GBP/USD steadies below 1.3400 as traders assess BoE policy outlook

Following Thursday's volatile session, GBP/USD moves sideways below 1.3400 on Friday. Investors reassess the Bank of England's policy oıtlook after the MPC decided to cut the interest rate by 25 bps by a slim margin. Meanwhile, the improving risk mood helps the pair hold its ground.

Gold: 2026 could see new record-highs but a 2025-like rally is unlikely

Gold started the year on a bullish note and registered impressive gains in the first quarter. Following a consolidation phase during the summer months, the precious metal surged higher in the third quarter and reached an all-time record high of $4,381 in October. Although XAU/USD corrected lower, buyers refused to hand over the reins heading into the holiday season.

Week ahead: Key risks to watch in last days of 2025 and early 2026

The festive period officially starts next week, with many traders vacating their desks until the first full week of January, making way for thin trading volumes and very few top-tier releases.

How much can one month of soft inflation change the Fed’s mind?

One month of softer inflation data is rarely enough to shift Federal Reserve policy on its own, but in a market highly sensitive to every data point, even a single reading can reshape expectations. November’s inflation report offered a welcome sign of cooling price pressures. 

XRP rebounds amid ETF inflows and declining retail demand demand

XRP rebounds as bulls target a short-term breakout above $2.00 on Friday. XRP ETFs record the highest inflow since December 8, signaling growing institutional appetite.