|

GBP/USD Price Analysis: Inside the woods ahead of FOMC minutes

  • GBP/USD is oscillating in a 1.2000-1.2126 range for the past 10 trading sessions.
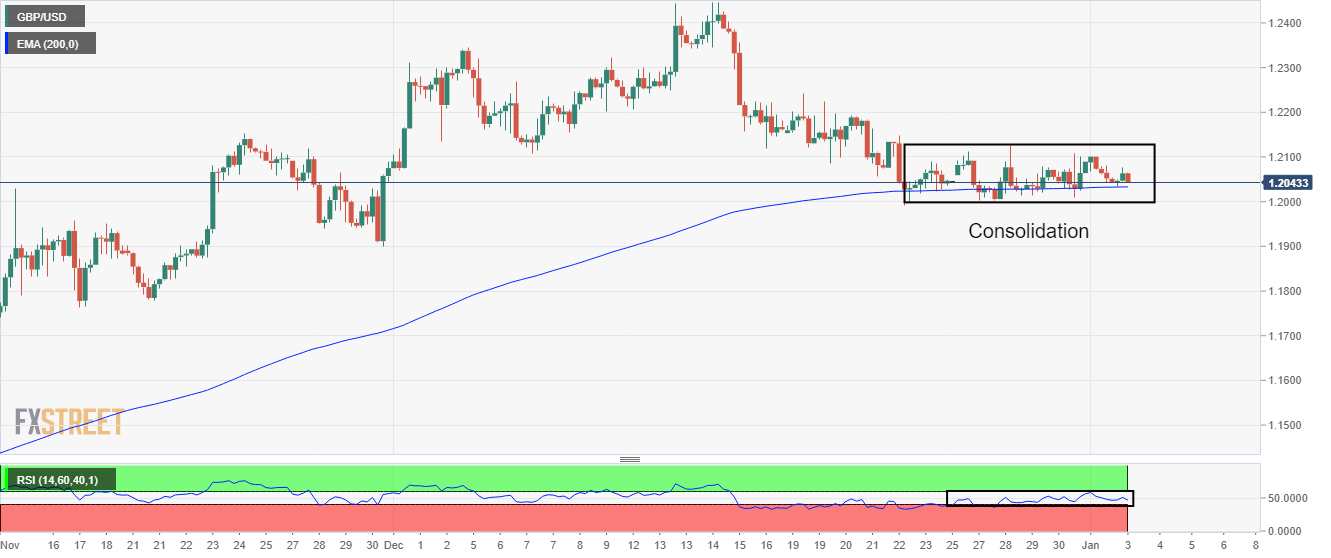
  • The 200-EMA around 1.2027 is acting as a major cushion for the Cable.
  • A 40.00-60.00 range oscillation by the RSI (14) indicates an absence of a potential trigger.

The GBP/USD pair has delivered an upside break of the consolidation formed in a narrow range of 1.2040-1.2046 in the Asian session. The Cable asset has climbed above 1.2060 but is still likely to remain inside the woods as the market mood is still quiet.

It is difficult to ascertain the risk profile at the current juncture as the trading activity is still low. Meanwhile, S&P500 futures have initiated the week on a bearish note, portraying caution ahead of the release of the Federal Open Market Committee (FOMC) minutes this week.

On a four-hour scale, the Cable asset is tightly holding the cushion from the 200-period Exponential Moving Average (EMA) around 1.2027. As the 200-EMA has turned flat, a rangebound performance is likely to persist ahead till the absence of a potential trigger. For the past 10 trading sessions, the Cable is oscillating in a range of 1.2000-1.2126.

The Relative Strength Index (RSI) (14) is continuously oscillating in a 40.00-60.00 range, which indicates volatility contraction, which will be followed by a breakout in the same.

Should the Cable break above December 26 high at 1.2126, Pound Sterling bulls will drive the major towards the round-level resistance at 1.2200. A breach of the latter will drive the pair towards December 12 high around 1.2300.

Alternatively, a break below the psychological support of 1.2000 will drag the Cable towards November 18 high around 1.1950 followed by November 30 low at 1.1900.

GBP/USD four-hour chart

GBP/USD

Overview
Today last price1.2054
Today Daily Change0.0005
Today Daily Change %0.04
Today daily open1.2049
 
Trends
Daily SMA201.2151
Daily SMA501.1922
Daily SMA1001.1667
Daily SMA2001.2041
 
Levels
Previous Daily High1.2102
Previous Daily Low1.2034
Previous Weekly High1.2126
Previous Weekly Low1.2002
Previous Monthly High1.2447
Previous Monthly Low1.1992
Daily Fibonacci 38.2%1.206
Daily Fibonacci 61.8%1.2076
Daily Pivot Point S11.2021
Daily Pivot Point S21.1994
Daily Pivot Point S31.1954
Daily Pivot Point R11.2089
Daily Pivot Point R21.2129
Daily Pivot Point R31.2156

Author

Sagar Dua

Sagar Dua

FXStreet

Sagar Dua is associated with the financial markets from his college days. Along with pursuing post-graduation in Commerce in 2014, he started his markets training with chart analysis.

More from Sagar Dua
Share:

Editor's Picks

EUR/USD eyes nine-day EMA barrier after rebounding from 1.1600

EUR/USD gains ground after registering modest losses in the previous session, trading around 1.1620 during the Asian hours on Friday. The technical analysis of the daily chart suggests an ongoing bearish bias as the pair remains within the descending channel pattern.

GBP/USD drifts lower heading into NFP range

GBP/USD edged lower by 0.2% on Thursday, settling close to 1.3350 in a strained trading session that kept the pair pinned near three-month lows. Price briefly recovered earlier in the day on reports that Iran had indirectly signaled openness to talks with the CIA, but the bounce faded as Israeli officials reportedly advised Washington to disregard the overture. 

Gold recovers above $5,100 ahead of US NFP report

Gold price jumps back above $5,100 in the Asian session on Friday. The precious metal regains traction, helped by a fresh bout of US Dollar selling and persisting risk-off flows. The US employment report for February will take center stage later on Friday. 

Ethereum pull in $169M as validators pile in to stake ETH

US spot Ethereum exchange-traded funds recorded $169 million in net inflows on Wednesday, marking the largest daily intake in two months, according to SoSoValue data. The rise in inflows signals renewed institutional interest in Ethereum amid broader market volatility.

The market compass is pointing at a barrel of Oil

The Asian open is arriving with equities leaning the wrong way, and the reason is not complicated. The market’s compass needle has snapped firmly toward crude. In this tape, oil is not just another input price; it is the gravitational center around which every asset class is orbiting.

Ripple tests recovery strength amid steady ETF inflows, growing retail interest

Ripple (XRP) continues to demonstrate notable resilience as the cryptocurrency market navigates the persistent war in the Middle East after the United States (US) and Israel attacked Iran on Saturday.