GBP/USD Price Analysis: Holds position above 1.2850 nearing a pullback resistance
- GBP/USD moves upward within an ascending channel, signaling a bullish bias.
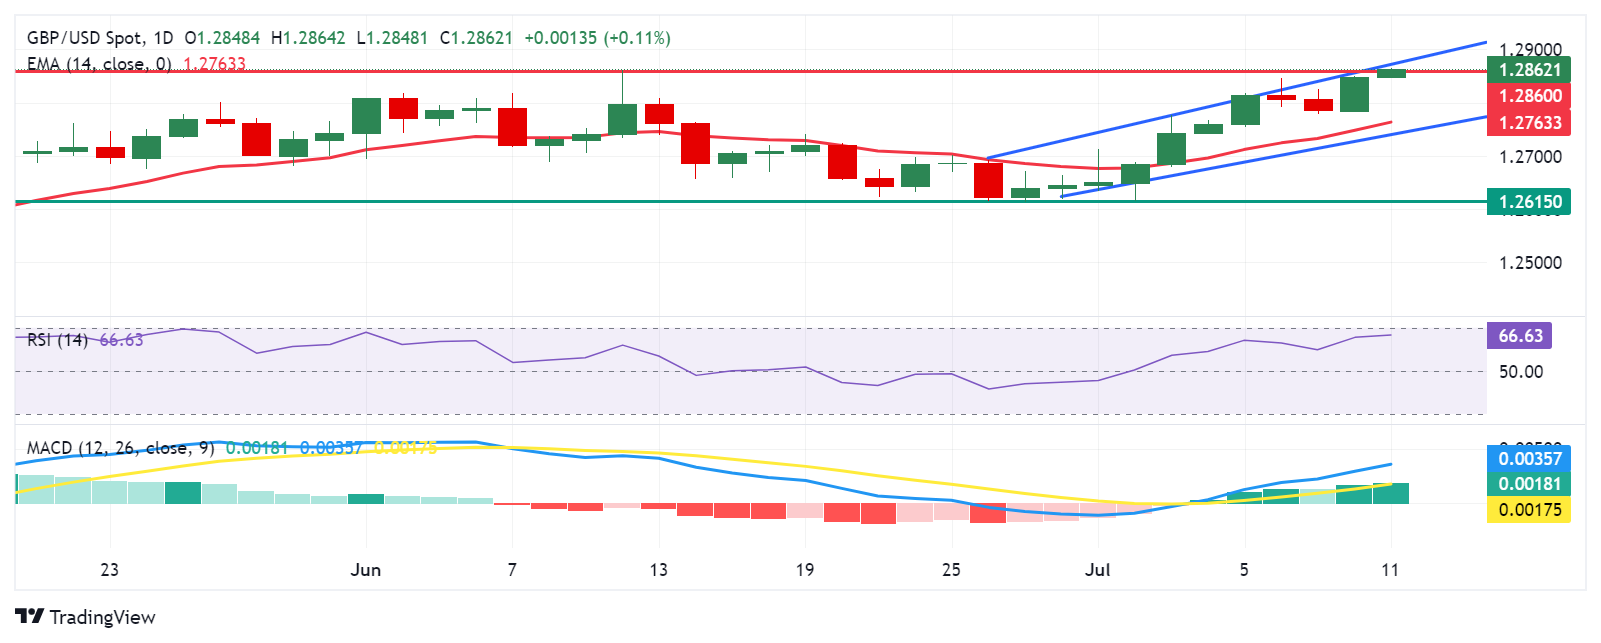
- The 14-day RSI is positioned just below the 70 level, indicating potential overbought conditions in the pair.
- A break above the pullback resistance at the 1.2860 level could lead the pair to test the upper boundary.

GBP/USD continues to advance for the second consecutive session, trading around 1.2860 during Asian hours on Thursday. The analysis of the daily chart shows that the pair is moving upward within an ascending channel, which indicates a bullish bias in the pair's price action.
Additionally, the 14-day Relative Strength Index (RSI) is positioned slightly below the 70 level, indicating confirmation of the bullish trend while also suggesting potential overbought conditions. A breach above this level could signal a need for caution, possibly indicating a forthcoming correction.
Furthermore, the Moving Average Convergence Divergence (MACD) momentum indicator indicates bullish momentum in the short term. This is evidenced by the MACD line being above the centerline and showing divergence above the signal line.
In terms of resistance, the GBP/USD pair tests pullback resistance near the 1.2860 level. A successful breakthrough above this barrier could potentially push the pair higher to test the upper boundary of the ascending channel around the 1.2870 level.
On the downside, the GBP/USD pair could encounter significant support near the 14-day Exponential Moving Average (EMA) at the 1.2763 level. If this level is breached, it may lead to increased selling pressure, potentially testing the lower boundary of the ascending channel around 1.2740. Further support could be found around the throwback support level of 1.2615.
GBP/USD: Daily Chart
British Pound PRICE Today
The table below shows the percentage change of British Pound (GBP) against listed major currencies today. British Pound was the strongest against the US Dollar.
| USD | EUR | GBP | JPY | CAD | AUD | NZD | CHF | |
|---|---|---|---|---|---|---|---|---|
| USD | -0.07% | -0.10% | -0.03% | -0.03% | -0.21% | -0.27% | -0.04% | |
| EUR | 0.07% | -0.02% | 0.04% | 0.05% | -0.13% | -0.19% | 0.00% | |
| GBP | 0.10% | 0.02% | 0.06% | 0.07% | -0.11% | -0.16% | 0.05% | |
| JPY | 0.03% | -0.04% | -0.06% | -0.01% | -0.19% | -0.28% | -0.04% | |
| CAD | 0.03% | -0.05% | -0.07% | 0.00% | -0.20% | -0.25% | -0.03% | |
| AUD | 0.21% | 0.13% | 0.11% | 0.19% | 0.20% | -0.07% | 0.16% | |
| NZD | 0.27% | 0.19% | 0.16% | 0.28% | 0.25% | 0.07% | 0.22% | |
| CHF | 0.04% | -0.01% | -0.05% | 0.04% | 0.03% | -0.16% | -0.22% |
The heat map shows percentage changes of major currencies against each other. The base currency is picked from the left column, while the quote currency is picked from the top row. For example, if you pick the British Pound from the left column and move along the horizontal line to the US Dollar, the percentage change displayed in the box will represent GBP (base)/USD (quote).
Author

Akhtar Faruqui
FXStreet
Akhtar Faruqui is a Forex Analyst based in New Delhi, India. With a keen eye for market trends and a passion for dissecting complex financial dynamics, he is dedicated to delivering accurate and insightful Forex news and analysis.


