|

GBP/USD Price Analysis: Consolidates below 1.2700; 50/100-day SMAs confluence holds the key

  • GBP/USD remains confined in a narrow range for the second straight day on Wednesday.
  • The mixed fundamental backdrop holds back traders from placing fresh directional bets.
  • A break below the 1.2645-1.2640 confluence support will pave the way for deeper losses. 

The GBP/USD pair extends its sideways consolidative price move for the second straight day and remains confined in a narrow range below the 1.2700 mark during the Asian session on Wednesday. The lack of any meaningful buying, meanwhile, warrants some caution before positioning for an extension of the recent bounce from the 1.2625-1.2620 region, or the lowest level since mid-May touched last Friday.

Against the backdrop of the Federal Reserve's (Fed) hawkish surprise earlier this month, policymakers have backed the case for keeping interest rates higher for longer. The markets, however, are still pricing in a greater chance that the US central bank will start cutting interest rates in September, which keeps the US Dollar (USD) bulls on the defensive and acts as a tailwind for the GBP/USD pair. That said, the Bank of England's (BoE) dovish pause last week caps the upside for the British Pound (GBP) and the currency pair ahead of the UK general election on July 4.

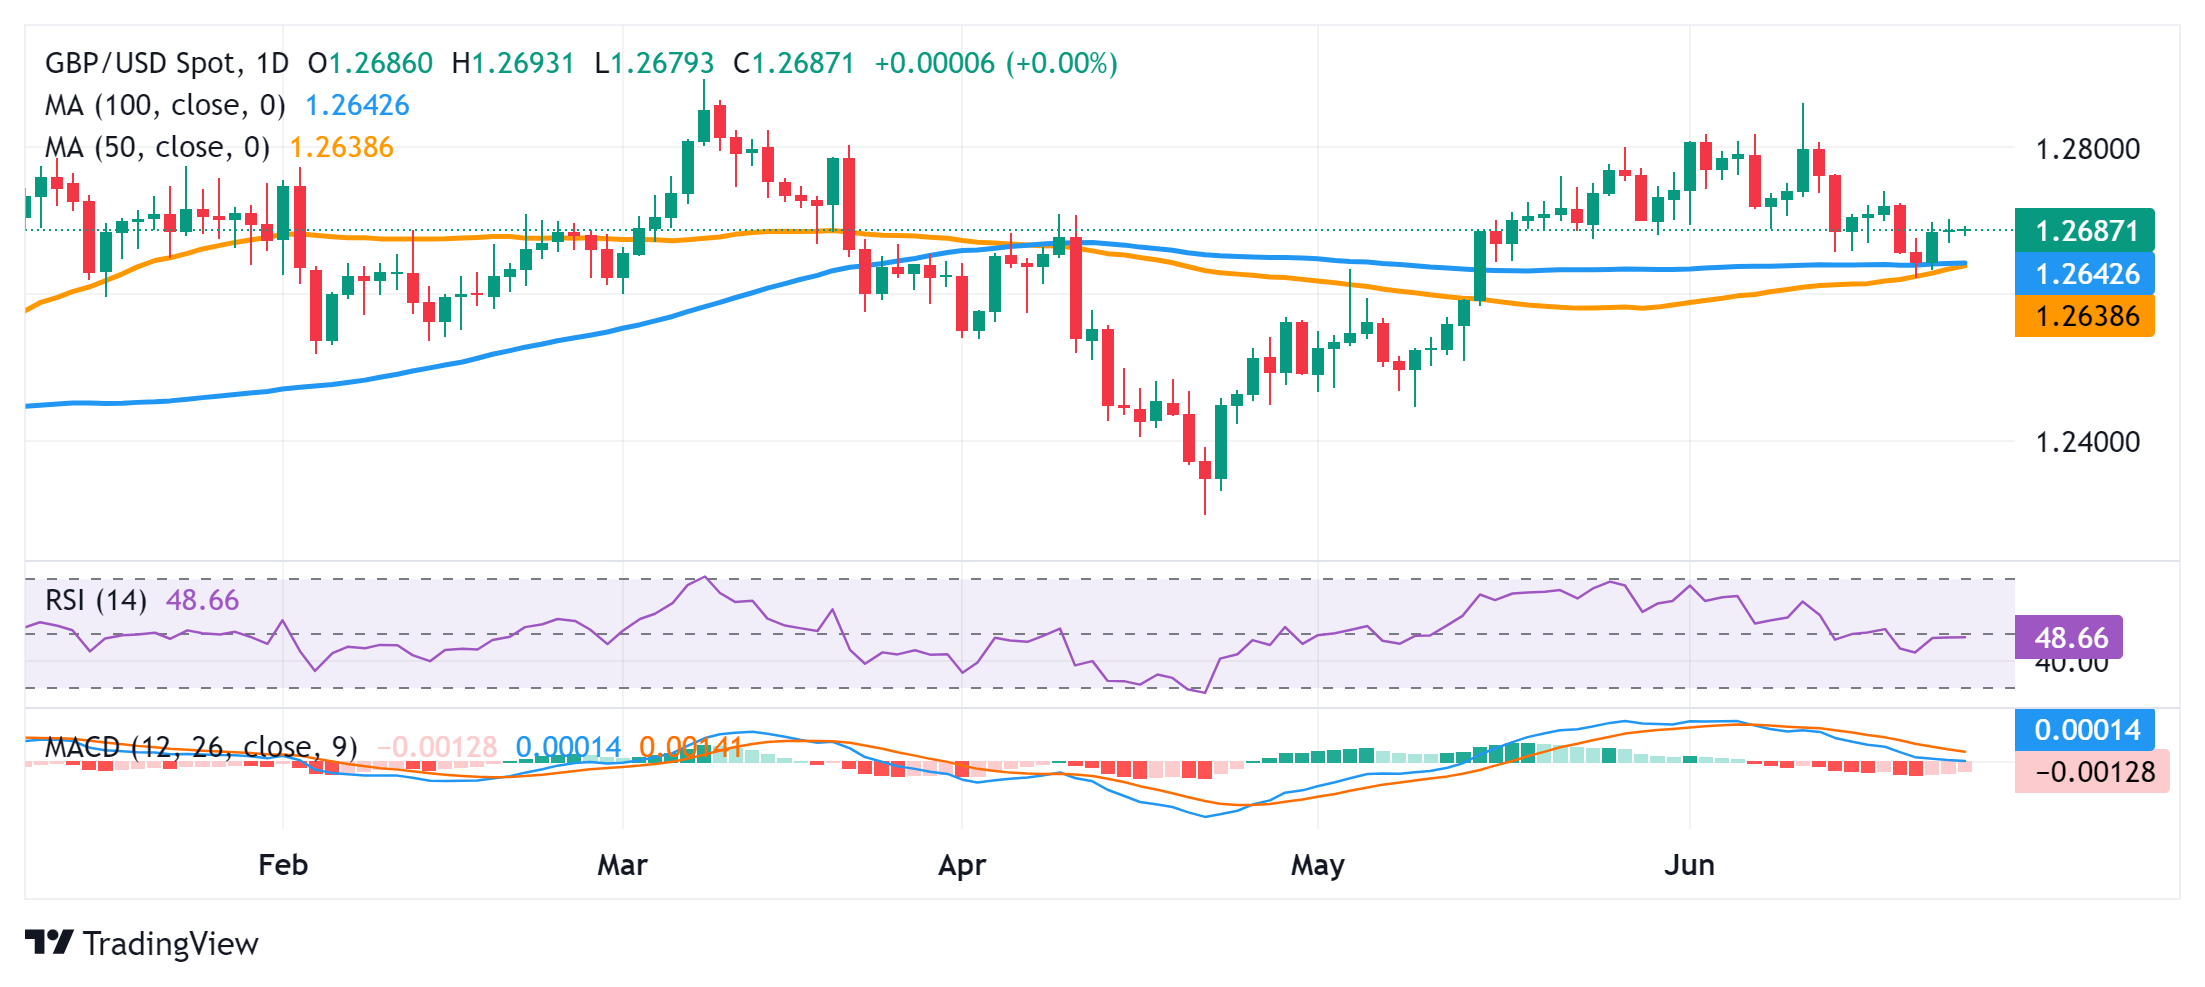
From a technical perspective, the recent pullback from the 1.2860 area, or a three-month peak touched on June 12 stalled near the 50-day Simple Moving Average (SMA). The said support is currently pegged near the 1.2645-1.2640 region, which now coincides with the 100-day SMA and should act as a key pivotal point. A convincing break below will be seen as a fresh trigger for bearish traders and drag the GBP/USD pair further below the 1.2600 round figure, towards testing the next relevant support near the 1.2560-1.2555 zone en route to the 1.2500 psychological mark.

On the flip side, the 1.2700 round figure is likely to act as an immediate hurdle ahead of the 1.2720-1.2725 supply zone. Some follow-through buying and a sustained strength beyond will suggest that the recent corrective decline has run its course. Given that oscillators have been recovering on the daily chart, the GBP/USD pair might then accelerate the move towards reclaiming the 1.2800 mark. Bulls might eventually aim to challenge the multi-month top, around the 1.2860 region, and lift spot prices further towards the 1.2900 round figure.

GBP/USD daily chart

fxsoriginal

GBP/USD

Overview
Today last price1.2687
Today Daily Change0.0001
Today Daily Change %0.01
Today daily open1.2686
 
Trends
Daily SMA201.2729
Daily SMA501.2634
Daily SMA1001.2642
Daily SMA2001.2559
 
Levels
Previous Daily High1.2703
Previous Daily Low1.267
Previous Weekly High1.274
Previous Weekly Low1.2623
Previous Monthly High1.2801
Previous Monthly Low1.2446
Daily Fibonacci 38.2%1.269
Daily Fibonacci 61.8%1.2683
Daily Pivot Point S11.267
Daily Pivot Point S21.2654
Daily Pivot Point S31.2638
Daily Pivot Point R11.2703
Daily Pivot Point R21.2719
Daily Pivot Point R31.2735

Author

Haresh Menghani

Haresh Menghani is a detail-oriented professional with 10+ years of extensive experience in analysing the global financial markets.

More from Haresh Menghani
Share:

Editor's Picks

AUD/USD eyes 0.7150 barrier nine-day EMA

AUD/USD inches higher after registering modest losses in the previous day, trading around 0.7130 during the Asian hours. The technical analysis of the daily chart indicates that the pair is moving sideways within the rectangle pattern, suggesting a consolidation as neither the bulls nor the bears have enough momentum to take control of the market.

USD/JPY trades below 160.00 intervention threshold; bullish bias intact

The USD/JPY pair attracts some sellers during the Asian session amid fears that authorities will step in again to prop up the Japanese Yen. Furthermore, the Israel-Lebanon truce prompts some profit-taking around the US Dollar and exerts downward pressure on the currency pair.

Gold defends 200-day SMA, rises toward $4,500

Gold is attempting a tepid recovery toward $4,500 on Thursday, as renewed optimism in the Mideast geopolitical front calms market nerves. This cautious optimism across Asian markets weighs on Oil prices, and diminishes the US Dollar’s safe-haven appeal, helping Gold stage a decent comeback from the weekly low of $4,424.


Hyperliquid: ETF demand, capital rotation fuel HYPE rally as Bitcoin melts

Hyperliquid price sustains an upward trend near its all-time high of $75.76 on Thursday after posting 80% gains in May, while Bitcoin (BTC) retraces below $65,000, triggering a market-wide panic.

Kevin Warsh takes the Fed helm: What it means for the US Dollar
The Federal Reserve moves away from the highly predictable "forward guidance" model of the Jerome Powell era to a new “Kevin Warsh environment”, characterized by less communication, more policy surprises, and an increased focus on the Fed's complex balance sheet.
Recession on paper: What really moves the Canadian Loonie now?

Statistics Canada handed the headline writers a gift and the analysts a headache. Real GDP shrank 0.1% on an annualized basis in the first quarter, and with the fourth quarter of 2025 revised down to a 1.0% contraction, that is two negative quarters in a row, the textbook definition of a technical recession and Canada's first since the pandemic.