|

GBP/USD Price Analysis: Climbs on USD weakness but fails to conquer the 200-DMA

  • GBP/USD rallied almost 1% or 114 pips on Friday, post US NFP.
  • Bulls struggle at the 200-day EMA, exacerbating a GBP/USD fall of 60 pips to current rates.
  • GBP/USD Price Analysis: The bias is bearish, but upside risks remain.

GBP/USD recovers some ground getting ready to finish the week with minimal gains after bouncing off YTD lows at 1.1802, with buyers reclaiming 1.2000 on a mixed US jobs report. At the time of writing, the GBP/USD is trading at 1.2040, above its opening price y 1.01%.

GBP/USD Price Action

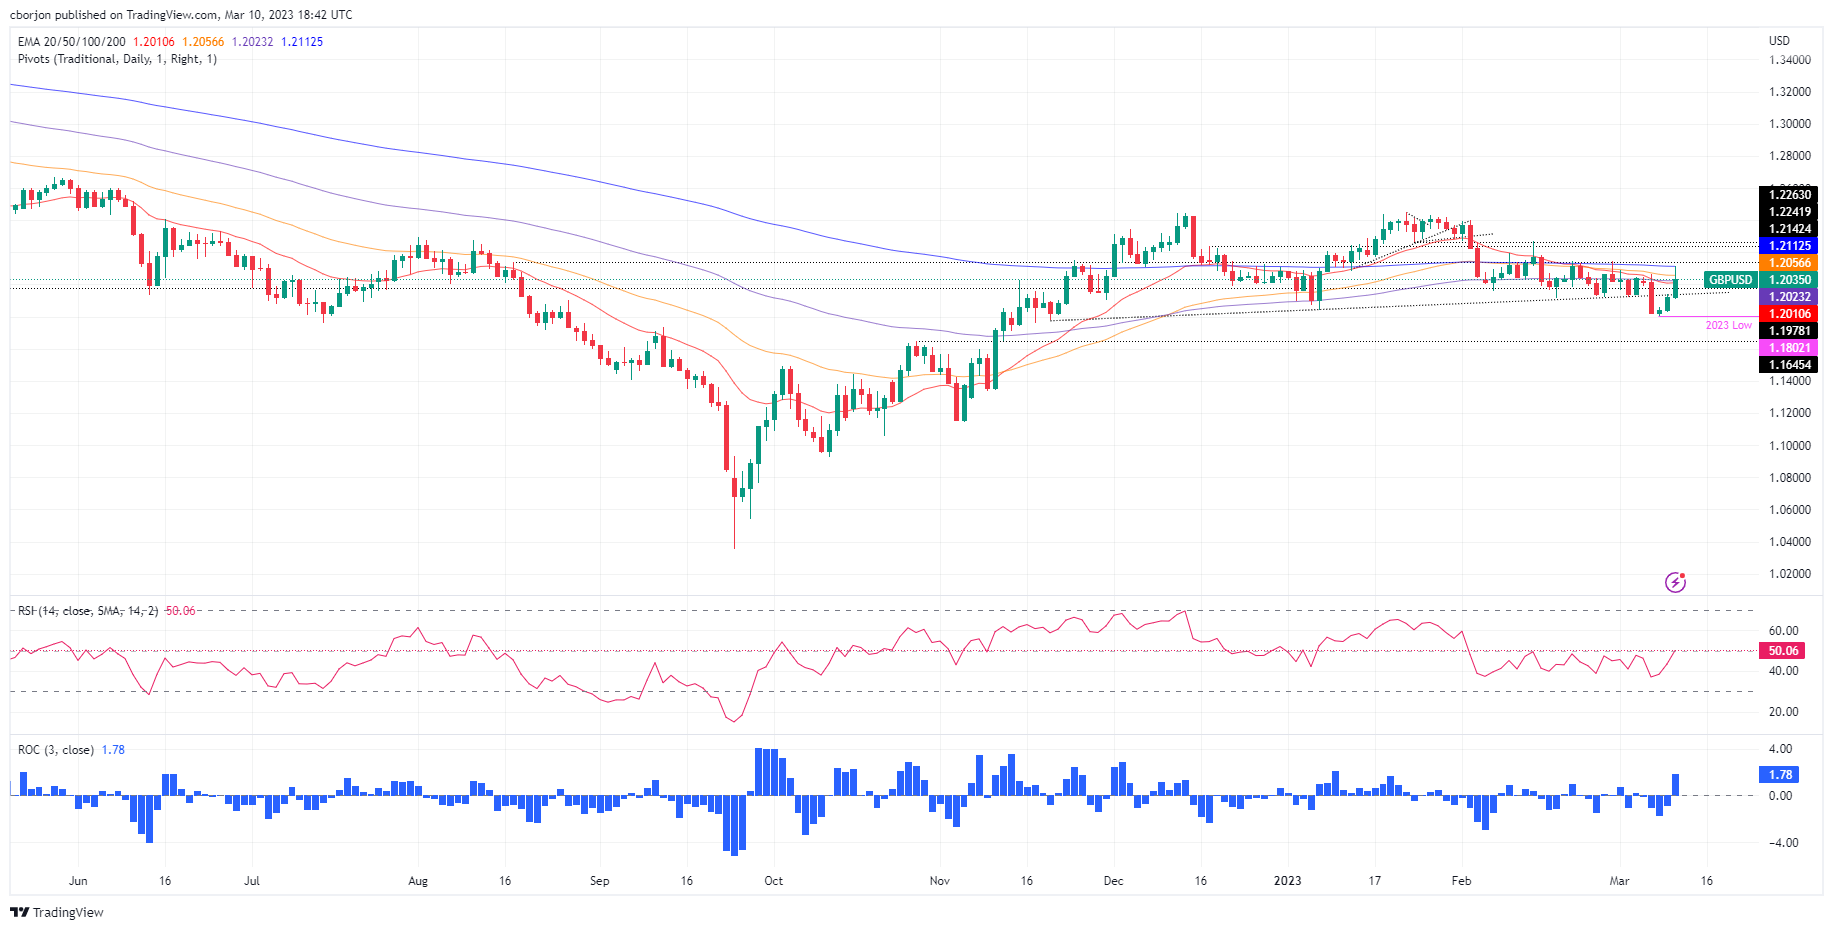
The GBP/USD has reclaimed the 1.2000 figure, but its bias has not changed. The aftermath of the US Nonfarm Payrolls report witnessed the Pound Sterling (GBP) reaching the 200-day Exponential Moving Average (EMA) at 1.2112. However, sellers stepped in and dragged the spot beneath the 1.2100 mark.

On its way south, the GBP/USD pierced under the 50-day EMA, leaving the exchange rates around familiar levels. Nevertheless, the 100 and 20-day EMAs are resting below the current prices, warranting further consolidation ahead.

For a bearish resumption, the GBP/USD needs to crack the 100 and 20-day EMAs, each at 1.2023 and 1.2010, respectively. After that, the 1,2000 figure could be grabbed, paving the way for further downside. The following support would be the 1.1900 figure, ahead of the YTD low at 1.1802.

Conversely, the GBP/USD must reclaim the 50-day EMA at 1.2056 if buyers want to remain hopeful of shifting the trend. The next resistance would be 1.2100, followed by the 200-day EMA at 1.2112.

GBP/USD Daily Chart

GBP/USD Technical Levels

GBP/USD

Overview
Today last price1.204
Today Daily Change0.0121
Today Daily Change %1.02
Today daily open1.1919
 
Trends
Daily SMA201.2015
Daily SMA501.213
Daily SMA1001.201
Daily SMA2001.1903
 
Levels
Previous Daily High1.1939
Previous Daily Low1.1832
Previous Weekly High1.2143
Previous Weekly Low1.1922
Previous Monthly High1.2402
Previous Monthly Low1.1915
Daily Fibonacci 38.2%1.1898
Daily Fibonacci 61.8%1.1873
Daily Pivot Point S11.1854
Daily Pivot Point S21.179
Daily Pivot Point S31.1747
Daily Pivot Point R11.1961
Daily Pivot Point R21.2003
Daily Pivot Point R31.2068

Author

Christian Borjon Valencia

Markets analyst, news editor, and trading instructor with over 14 years of experience across FX, commodities, US equity indices, and global macro markets.

More from Christian Borjon Valencia
Share:

Editor's Picks

GBP/USD bounces off lows, back above 1.3200

After bottoming out near 1.3160, GBP/USD manages to regain a bit of shine and reclaim the 1.3200 mark and beyond at the end of the week. Stronger-than-expected UK Retail Sales data seem to be helping the British Pound limit its losses, while the chaotic UK political environment keeps the bulls at bay for now.

EUR/USD looks consolidative around 1.1460

EUR/USD stages a modest rebound after slipping to a three-month low below 1.1420 at the end of the week. That said, the pair now looks to consolidate humble gains just above 1.1460 despite growing uncertainty surrounding the next round of US-Iran negotiations, which keeps the US Dollar’s downside contained.

Gold slips back to six-day lows, targets $4,100

Gold retreats for the third consecutive day on Friday, eroding gains seen in the first half of the week and approaching the key $4,100 mark per troy ounce. Indeed, the precious metal continues to face headwinds from the Fed's hawkish stance and renewed uncertainty surrounding the next round of US-Iran negotiations.

Solana extends correction despite ETF inflows, RWA adoption

Solana (SOL) price edges below $70 extending its losses for the fourth straight day this week. The institutional demand for Solana is building, with steady inflows so far this week and Morgan Stanley’s amended S-1 filing for a Solana-focused Exchange-Traded Fund.

The Iran war didn't break the US economy, but what happens next?

Nearly four months after the start of the Iran war, the US economy remains remarkably resilient. While the conflict initially triggered a severe disruption to global energy markets and a sharp rise in Oil prices, recent diplomatic progress between Washington and Tehran has eased concerns about a prolonged supply shock.

Regime change: Inside Kevin Warsh's first move to make the Fed unreadable on purpose

The rate did not move. That was the least interesting thing about Kevin Warsh's first meeting in charge of the Fed. The FOMC held its benchmark at 3.50%-3.75% for the fourth straight meeting, exactly as priced, and then the new chair used his first press conference to dismantle the machinery the market has leaned on for a decade.