|

GBP/USD Price Analysis: Bulls have the upper hand above 1.2800, highest since March

  •  GBP/USD struggles to capitalize on the move to a nearly three-month high set this Tuesday.
  • Fed rate cut bets keep the USD bulls on the defensive and lend some support to the major.
  • The technical setup validates the positive outlook and supports prospects for further gains.

The GBP/USD pair climbs to its highest level since March 14 during the Asian session on Tuesday, albeit struggles to capitalize on the move and is currently placed just above the 1.2800 mark. The near-term bias, meanwhile, seems tilted in favor of bullish traders in the wake of the prevalent selling bias surrounding the US Dollar (USD).

In fact, the USD Index (DXY), which tracks the Greenback against a basket of currencies, drops to a nearly two-month low on the back of rising bets for an imminent rate cut by the Federal Reserve (Fed), bolstered by Monday's disappointing US ISM PMI. Apart from this, expectations that the Bank of England (BoE) might keep interest rates at their current level for a little bit longer should underpin the British Pound (GBP) and validate the near-term positive outlook for the GBP/USD pair. 

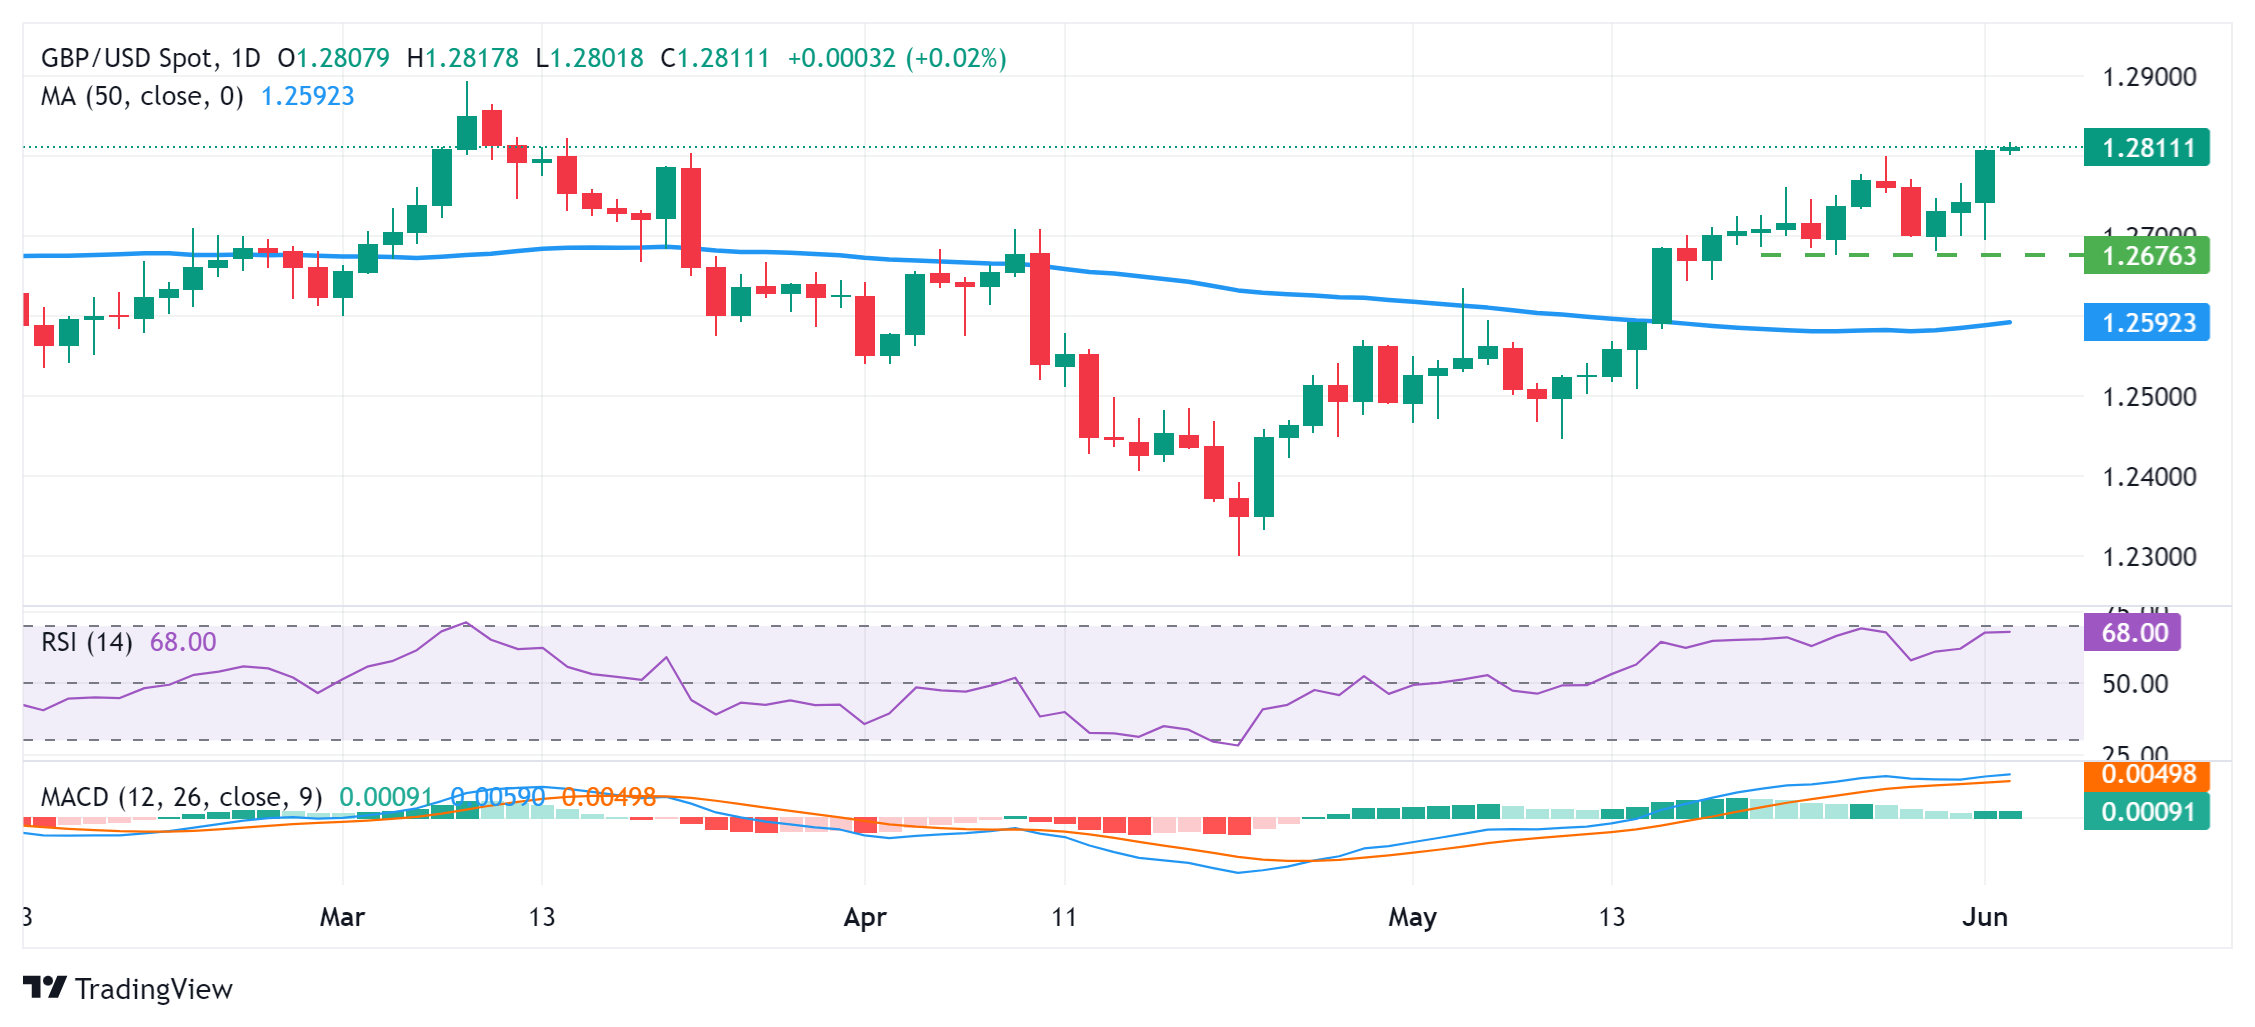
From a technical perspective, the overnight breakout through the 1.2800 mark could be seen as a fresh trigger for bullish traders. Moreover, oscillators on the daily chart have been gaining positive traction and are still away from being in the overbought territory. This, in turn, suggests that the path of least resistance for the GBP/USD pair is to the upside and supports prospects for a move to the 1.2855-1.2860 region en route to the 1.2900 neighborhood or the YTD peak touched in March.

On the flip side, weakness below the 1.2780-1.2775 immediate support might attract some buyers around the 1.2725-1.2720 area. This should help limit the downside for the GBP/USD pair near the 1.2700 mark. The latter should act as a key pivotal point, which if broken decisively should pave the way for a slide towards the next relevant support near mid-1.2600s. Spot prices might eventually drop to test the 50-day Simple Moving Average (SMA) support near the 1.2600-1.2595 region.

GBP/USD daily chart

fxsoriginal

GBP/USD

Overview
Today last price1.2808
Today Daily Change0.0000
Today Daily Change %-0.00
Today daily open1.2808
 
Trends
Daily SMA201.2667
Daily SMA501.2589
Daily SMA1001.2634
Daily SMA2001.2543
 
Levels
Previous Daily High1.2809
Previous Daily Low1.2695
Previous Weekly High1.2801
Previous Weekly Low1.2681
Previous Monthly High1.2801
Previous Monthly Low1.2446
Daily Fibonacci 38.2%1.2765
Daily Fibonacci 61.8%1.2738
Daily Pivot Point S11.2732
Daily Pivot Point S21.2656
Daily Pivot Point S31.2618
Daily Pivot Point R11.2846
Daily Pivot Point R21.2884
Daily Pivot Point R31.296

Author

Haresh Menghani

Haresh Menghani is a detail-oriented professional with 10+ years of extensive experience in analysing the global financial markets.

More from Haresh Menghani
Share:

Editor's Picks

EUR/USD deflates to fresh lows, targets 1.1600

The selling pressure on EUR/USD now gathers extra pace, prompting the pair to hit fresh multi-week lows in the 1.1625-1.1620 band on Friday. The continuation of the downward bias comes in response to further gains in the US Dollar as market participants continue to assess the mixed release of US Nonfarm Payrolls in December.

GBP/USD breaks below 1.3400, challenges the 200-day SMA

GBP/USD remains under heavy fire and retreats for the fourth consecutive day on Friday. Indeed, Cable suffers the strong performance of the Greenback, intensified post-mixed NFP, and trades at shouting distance from its critical 200-day SMA near 1.3380.

Gold flirts with yearly tops around $4,500

Gold keeps its positive bias on Friday, adding to Thursday’s advance and challenging yearly highs in the $4,500 region per troy ounce. The risk-off sentiment favours the yellow metal despite the firmer tone in the Greenback and rising US Treasury yields.

Crypto Today: Bitcoin, Ethereum, XRP risk further decline as market fear persists amid slowing demand

Bitcoin holds $90,000 but stays below the 50-day EMA as institutional demand wanes. Ethereum steadies above $3,000 but remains structurally weak due to ETF outflows. XRP ETFs resume inflows, but the price struggles to gain ground above key support.

Week ahead – US CPI might challenge the geopolitics-boosted Dollar

Geopolitics may try to steal the limelight from US data. A possible US Supreme Court ruling on tariffs could dictate market movements. A crammed data calendar next week, US CPI comes on Tuesday; Fedspeak to intensify.

XRP trades under pressure amid weak retail demand

XRP presses down on the 50-day EMA support as risk-averse sentiment spreads despite a positive start to 2026. XRP faces declining retail demand, as reflected in futures Open Interest, which has fallen to $4.15 billion.