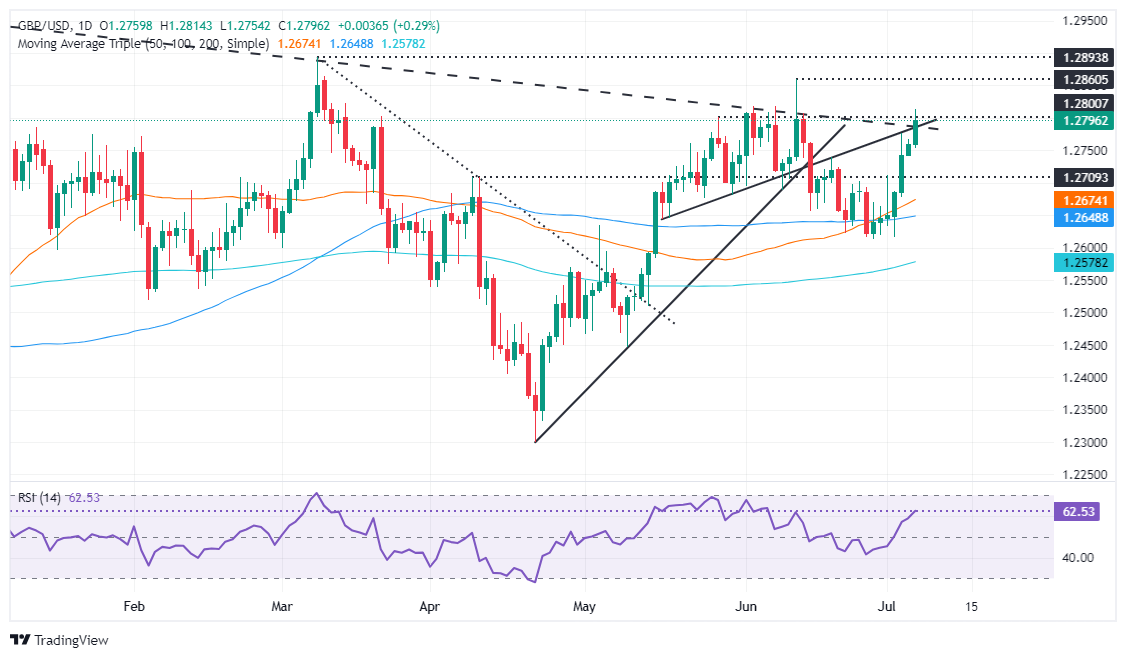
GBP/USD Price Analysis: Ascends on weak US Dollar, bulls eye daily close above 1.2800
- GBP/USD climbs over 0.20%, after US jobs report reveals June gains but revises down April and May.
- Bullish technical outlook as GBP/USD nears key resistance at 1.2660/75.
- Resistance levels: 1.2800, 1.2894 (YTD high), 1.2900, 1.2995 (July 27, 2023, high), approaching 1.3000.
- Support points: 1.2733 (July 4 low), 1.2709 (April 8 high), 1.2700, 1.2673 (50-DMA).

The GBP/USD registered decent gains of more than 0.20% on Friday after June’s US jobs data showed the economy added more jobs than expected, though a revision lower of April and May’s figures hinted the labor market weakened further. The major trades at 1.2790, above its opening price, after hitting a daily low of 1.2752.
GBP/USD Price Analysis: Technical outlook
The GBP/USD has fluctuated around the 1.2800 psychological level during the day, threatening to achieve a daily close above crucial resistance trendlines that have so far turned support at around 1.2660/75.
Momentum remains bullish, as depicted by the Relative Strength Index (RSI), aiming higher after it pierced the 50-neutral line on June 2.
Hence, the GBP/USD path of least resistance is to the upside. Buyers achieving a daily close above 1.2800 would pave the way to challenge the year-to-date (YTD) high of 1.2894. Further upside is seen if the pair hurdles that level, with the next resistance at 1.2900, followed by a July 27, 2023, high of 1.2995 ahead of 1.3000.
For a bearish reversal, sellers will expect the exchange rate to fall below the July 4 daily low of 1.2733. This will expose April’s 8 high, which turned support at 1.2709 before exposing 1.2700. On further losses, that will expose the 50-day moving average (DMA) at 1.2673.
GBP/USD Price Action – Daily Chart
British Pound PRICE Today
The table below shows the percentage change of British Pound (GBP) against listed major currencies today. British Pound was the strongest against the Canadian Dollar.
| USD | EUR | GBP | JPY | CAD | AUD | NZD | CHF | |
|---|---|---|---|---|---|---|---|---|
| USD | -0.13% | -0.30% | -0.19% | 0.14% | -0.17% | -0.26% | -0.21% | |
| EUR | 0.13% | -0.18% | -0.09% | 0.29% | -0.06% | -0.12% | -0.10% | |
| GBP | 0.30% | 0.18% | 0.10% | 0.46% | 0.13% | 0.05% | 0.06% | |
| JPY | 0.19% | 0.09% | -0.10% | 0.36% | 0.06% | -0.05% | -0.01% | |
| CAD | -0.14% | -0.29% | -0.46% | -0.36% | -0.34% | -0.40% | -0.39% | |
| AUD | 0.17% | 0.06% | -0.13% | -0.06% | 0.34% | -0.08% | -0.04% | |
| NZD | 0.26% | 0.12% | -0.05% | 0.05% | 0.40% | 0.08% | 0.01% | |
| CHF | 0.21% | 0.10% | -0.06% | 0.00% | 0.39% | 0.04% | -0.01% |
The heat map shows percentage changes of major currencies against each other. The base currency is picked from the left column, while the quote currency is picked from the top row. For example, if you pick the British Pound from the left column and move along the horizontal line to the US Dollar, the percentage change displayed in the box will represent GBP (base)/USD (quote).
Author

Christian Borjon Valencia
FXStreet
Markets analyst, news editor, and trading instructor with over 14 years of experience across FX, commodities, US equity indices, and global macro markets.


