GBP/USD Price Analysis: 200-day EMA returns to the bears’ radars
- GBP/USD drops 100-pips after rising to 1.2919 at the week’s start.
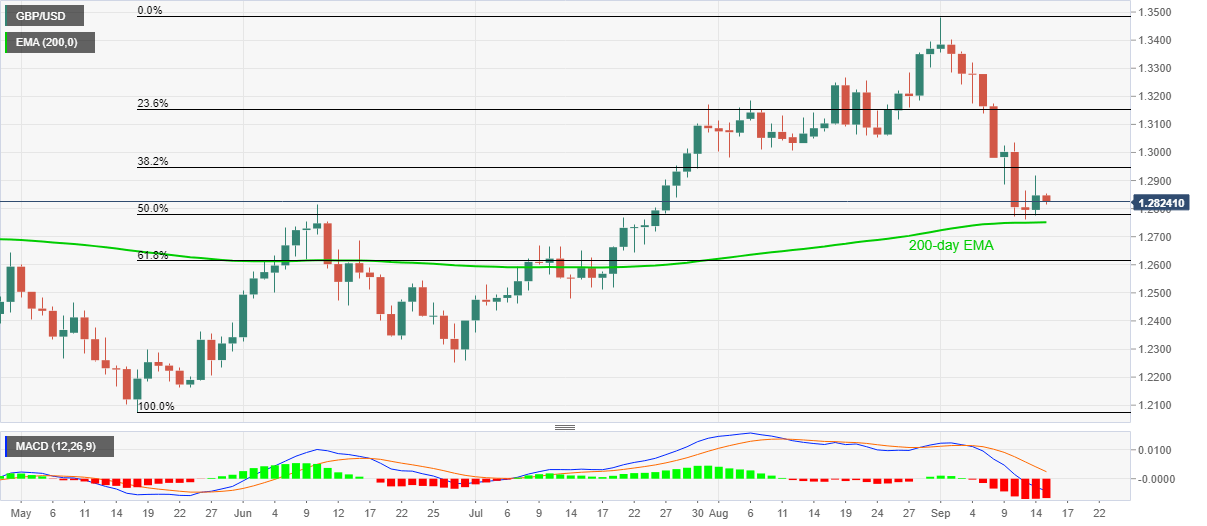
- Bearish MACD favors the sellers, 50% of Fibonacci retracement can offer immediate support.
- Bulls await a clear break of August month’s low to confirm entries.

GBP/USD prints 0.20% intraday loss while declining to 1.2820 during Tuesday’s Asian trading. In doing so, the Cable defies the previous day’s recovery moves amid downbeat MACD signals.
The bearish momentum also takes clues from the pair’s inability to cross the previous month’s low during the latest run-up.
As a result, sellers are currently targeting a 50% Fibonacci retracement of May-September upside, near 1.2780. However, a 200-day EMA level of 1.2751 will question the bears afterward.
Should the quote remains weak past-1.2751, the early-July top near 1.2670 may return to the chart.
On the contrary, a successful break of August month’s low near 1.2980 becomes necessary to convince the buyers before directing them to the 1.3000 threshold.
GBP/USD daily chart
Trend: Further weakness expected
Author

Anil Panchal
FXStreet
Anil Panchal has nearly 15 years of experience in tracking financial markets. With a keen interest in macroeconomics, Anil aptly tracks global news/updates and stays well-informed about the global financial moves and their implications.


