GBP/USD mildly up after PCE figures from the US meet expectations


  • The US PCE Price Index, rose to 2.5% YoY and 0.3% MoM in February, in line with market expectations.
  • The core PCE also met expectations.
  • With inflation indicators in sight, investors will eye next week's employment data, as its influence can potentially postpone any rate cut decision.

In Friday's session, GBP/USD is being traded around 1.2640, registering a variation of 0.14% as investors digest the US February Personal Consumption Expenditures (PCE) figures.

Inflation in the US increased slightly to 2.5% annually in February, as per the PCE Price Index, which the Fed prefers for tracking inflation. This was a minor rise from January's 2.4% and met expectations. The index rose by 0.3% from the previous month, a tad lower than the 0.4% forecast. Core PCE, excluding food and energy, also rose by 2.8% annually, aligning with predictions, and showed a 0.3% monthly increase. With January's core PCE figures revised up, ongoing inflation may lead the Federal Reserve (Fed) to maintain higher interest rates. Upcoming employment data will be key for future policy decisions, potentially affecting the timing and extent of rate cuts.

In line with that, hot employment data may push Fed policymakers to delay cuts beyond June and post just two instead of the three forecasted cuts for 2024 which could eventually benefit the US Dollar.

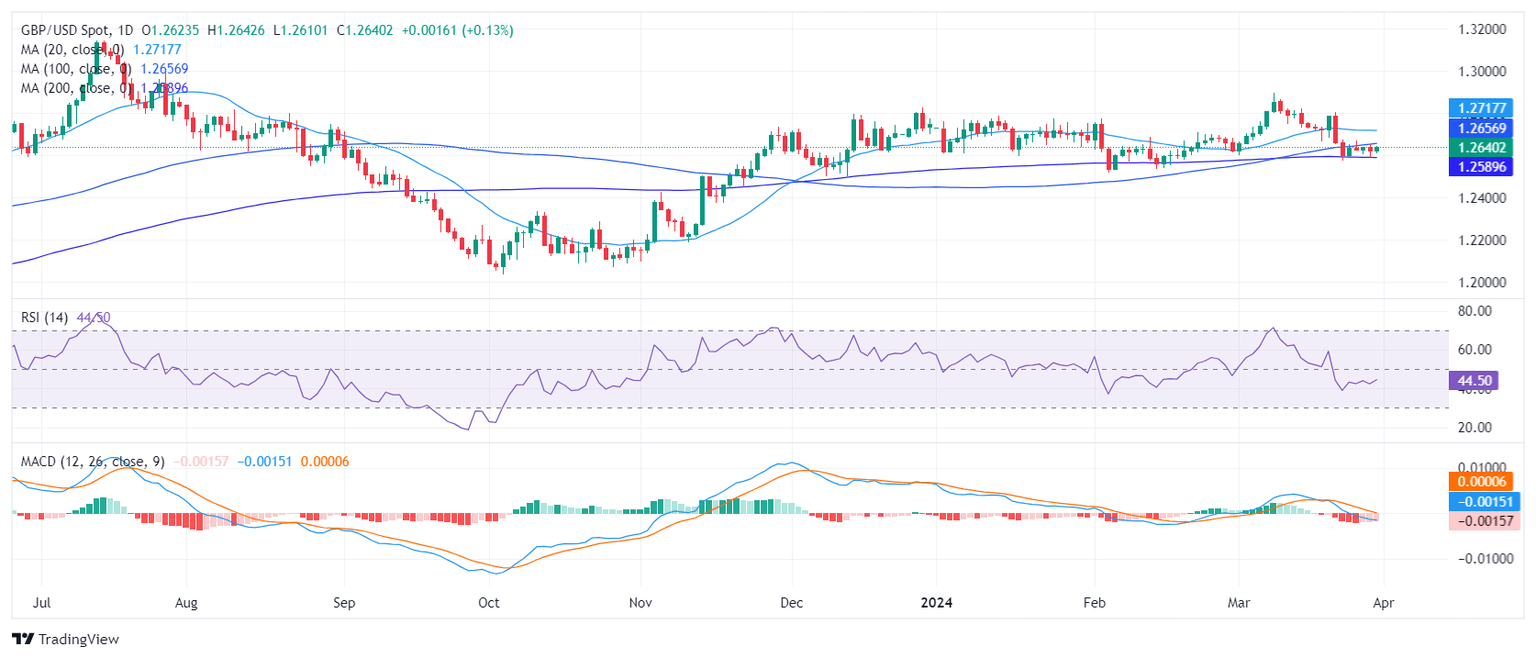
GBP/USD technical analysis

On the daily chart, the Relative Strength Index (RSI) for the GBP/USD pair is lingering in the negative territory, currently reading at 44. The prevalence of the RSI within the negative area indicates stronger selling momentum. Meanwhile, the flat red histogram of the Moving Average Convergence Divergence (MACD) implies fading bearish momentum but also serves as a caution to bulls.

On a larger scale, the pair is also below the 20 and 100-day Simple Moving Averages (SMAs), but above the 200-day SMA. This suggests that despite the current conditions, the bulls continue to exhibit strength in the overall trend.

GBP/USD

Overview
Today last price 1.264
Today Daily Change 0.0016
Today Daily Change % 0.13
Today daily open 1.2624
 
Trends
Daily SMA20 1.2719
Daily SMA50 1.2678
Daily SMA100 1.2653
Daily SMA200 1.259
 
Levels
Previous Daily High 1.2655
Previous Daily Low 1.2586
Previous Weekly High 1.2804
Previous Weekly Low 1.2575
Previous Monthly High 1.2773
Previous Monthly Low 1.2518
Daily Fibonacci 38.2% 1.2612
Daily Fibonacci 61.8% 1.2629
Daily Pivot Point S1 1.2588
Daily Pivot Point S2 1.2553
Daily Pivot Point S3 1.252
Daily Pivot Point R1 1.2657
Daily Pivot Point R2 1.269
Daily Pivot Point R3 1.2726


Share: Feed news

Information on these pages contains forward-looking statements that involve risks and uncertainties. Markets and instruments profiled on this page are for informational purposes only and should not in any way come across as a recommendation to buy or sell in these assets. You should do your own thorough research before making any investment decisions. FXStreet does not in any way guarantee that this information is free from mistakes, errors, or material misstatements. It also does not guarantee that this information is of a timely nature. Investing in Open Markets involves a great deal of risk, including the loss of all or a portion of your investment, as well as emotional distress. All risks, losses and costs associated with investing, including total loss of principal, are your responsibility. The views and opinions expressed in this article are those of the authors and do not necessarily reflect the official policy or position of FXStreet nor its advertisers. The author will not be held responsible for information that is found at the end of links posted on this page.

If not otherwise explicitly mentioned in the body of the article, at the time of writing, the author has no position in any stock mentioned in this article and no business relationship with any company mentioned. The author has not received compensation for writing this article, other than from FXStreet.

FXStreet and the author do not provide personalized recommendations. The author makes no representations as to the accuracy, completeness, or suitability of this information. FXStreet and the author will not be liable for any errors, omissions or any losses, injuries or damages arising from this information and its display or use. Errors and omissions excepted.

The author and FXStreet are not registered investment advisors and nothing in this article is intended to be investment advice.

Recommended content


Recommended content

Editors’ Picks

AUD/USD: Warming up or the RBA

AUD/USD: Warming up or the RBA

AUD/USD added to the move higher and rose to new two-month peaks near 0.6370 on the back of the soft tone in the US Dollar and rising expectation ahead of the RBA’s interest rate decision.

AUD/USD News
EUR/USD: Next target comes at 1.0530

EUR/USD: Next target comes at 1.0530

EUR/USD traded in an inconclusive fashion amid the equally vacillating development in the Greenback, returning to the sub-1.0500 region following reduced trading conditions in response to the US Presidents’ Day holiday.

EUR/USD News
Gold resumes the upside around $2,900

Gold resumes the upside around $2,900

Gold prices leave behind Friday's marked pullback and regain some composure, managing to retest the $2,900 region per ounce troy amid the generalised absence of volatility on US Presidents' Day holiday.

Gold News
Ethereum Price Forecast: ETH outperforms top cryptocurrencies, sees $1.1 billion in stablecoin inflows

Ethereum Price Forecast: ETH outperforms top cryptocurrencies, sees $1.1 billion in stablecoin inflows

Ethereum (ETH) is up 1% on Monday, stretching its weekly gains to nearly 3%, while other top blockchains experience losses. The top altcoin's recent outperformance can be attributed to rising stablecoin inflows and investment from institutional investors through ETH exchange-traded funds (ETFs).

Read more
Bitcoin Price Forecast: BTC stalemate soon coming to an end

Bitcoin Price Forecast: BTC stalemate soon coming to an end

Bitcoin price has been consolidating between $94,000 and $100,000 for almost two weeks. Amid this consolidation, investor sentiment remains indecisive, with US spot ETFs recording a $580.2 million net outflow last week, signaling institutional demand weakness.

Read more
The Best Brokers of the Year

The Best Brokers of the Year

SPONSORED Explore top-quality choices worldwide and locally. Compare key features like spreads, leverage, and platforms. Find the right broker for your needs, whether trading CFDs, Forex pairs like EUR/USD, or commodities like Gold.

Read More

Forex MAJORS

Cryptocurrencies

Signatures

Best Brokers of 2025