|

GBP/USD loses the 1.22 handle to close out Friday trading

  • The GBP/USD initially rose on Friday, but got knocked lower as the market broadly swept back into the US Dollar.
  • The US Dollar index caught a late bid to push back into the middle to close out the trading week.
  • Recession risk is still quite high in the UK, capping Pound Sterling bids.

The GBP/USD sank just south of the 1.2200 handle heading into the Friday market close, and the pair finds itself still struggling under the weight of a heavy bearish trend.

Inflation continues to be a hot topic for the Bank of England (BoE), and the UK may have no choice but to continue facing down high interest rates. With prices continuing to grow above the BoE's target, interest rate cuts remain a far-off dream for market investors hoping to get their borrowing and funding costs eased.

UK labor conditions continue to deteriorate, and the manufacturing outlook remains pessimistic looking forward.

Next week the UK will see Manufacturing Purchasing Manager Index (PMI) figures for September; the PMI data is broadly expected to show continued deterioration in economic expectations.

The US Dollar (USD) is set to remain well-bid through next week's trading window. An impending US government shutdown is seeing the Greenback bolstered across the broader market, and a government shutdown could see next week's Non-Farm Payrolls delayed.

Read More:

Forex Today: Another positive week for the Dollar

Pound Sterling fails to hold recovery as US Dollar recovers

GBP/USD technical outlook

The Sterling got rejected from the 200-hour Simple Moving Average after peaking at an intraday high of 1.2270 on Friday, sending the pair into a fresh low of 1.2180 for the day.

The GBP/USD is currently pinned to the midpoint at the 34-hour Exponential Moving Average (EMA) as intraday momentum bleeds out, and the midweek's bounce from a near-term low if 1.2110 looks set to run out of steam.

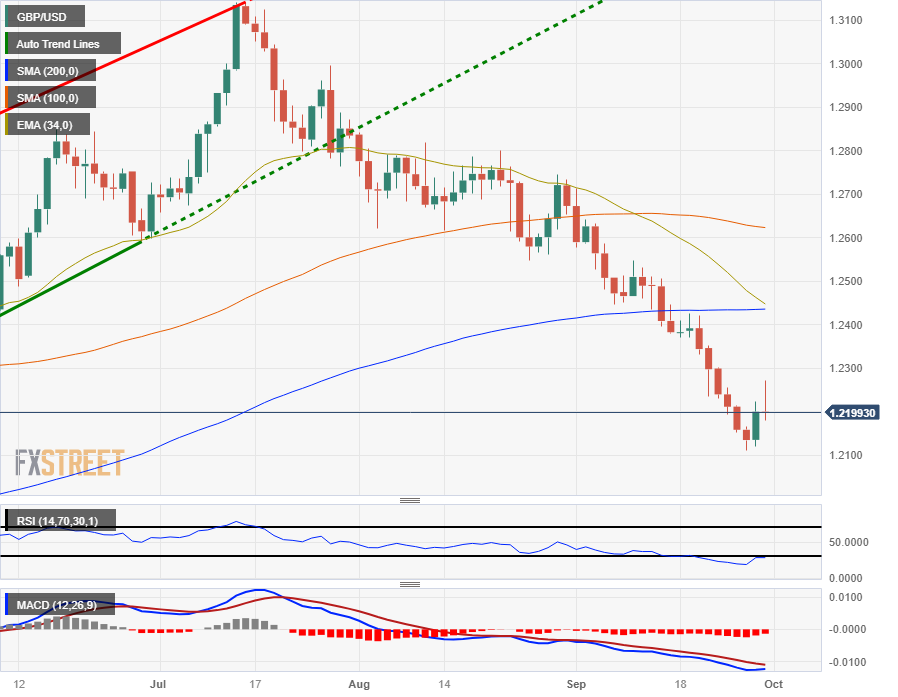
Daily candlesticks have the GBP/USD deeply off the beaten path, tumbling away from the 200-day SMA currently parked just above 1.2400, and the pair is set to continue charging into fresh six-month lows is selling pressure keeps up.

A descending 34-day EMA is providing dynamic resistance for any potential bullish pullbacks, and is currently priced in at the 200-day SMA, looking for a bearish crossover.

GBP/USD daily chart

GBP/USD technical levels

GBP/USD

Overview
Today last price1.2199
Today Daily Change-0.0001
Today Daily Change %-0.01
Today daily open1.22
 
Trends
Daily SMA201.2394
Daily SMA501.2602
Daily SMA1001.2626
Daily SMA2001.2435
 
Levels
Previous Daily High1.2225
Previous Daily Low1.212
Previous Weekly High1.2425
Previous Weekly Low1.2231
Previous Monthly High1.2841
Previous Monthly Low1.2548
Daily Fibonacci 38.2%1.2185
Daily Fibonacci 61.8%1.216
Daily Pivot Point S11.2139
Daily Pivot Point S21.2077
Daily Pivot Point S31.2034
Daily Pivot Point R11.2243
Daily Pivot Point R21.2286
Daily Pivot Point R31.2348

Author

Joshua Gibson

Joshua joins the FXStreet team as an Economics and Finance double major from Vancouver Island University with twelve years' experience as an independent trader focusing on technical analysis.

More from Joshua Gibson
Share:

Markets move fast. We move first.

Orange Juice Newsletter brings you expert driven insights - not headlines. Every day on your inbox.

By subscribing you agree to our Terms and conditions.

Editor's Picks

EUR/USD softens below 1.1750 after Fed Minutes

The EUR/USD pair attracts some sellers near 1.1745 during the early Asian session on Wednesday. The US Dollar edges higher against the Euro after the release of minutes from the Federal Reserve's December meeting. The US Initial Jobless Claims report will be released later in the day. Trading volumes are expected to remain thin ahead of the New Year holidays.

GBP/USD trades flat above 1.3450 amid thin trading volume

The GBP/USD pair holds steady around 1.3465 during the early Asian trading hours on Wednesday. However, the Bank of England guided that monetary policy will remain on a gradual downward path, which might underpin the Cable against the US Dollar. Financial markets are expected to trade on thin volumes as traders prepare for the New Year holiday.

Gold attempts another run toward $4,400 on final day of 2025

Gold price makes another attempt toward $4,400 in Asian trading on Tuesday, keeping the recovery mode intact following Monday's over 4% correction. The bright metal seems to cheer upbeat Chinese NBS and RatingDog Manufacturing and Services PMI data for December. 

Top Crypto Gainers: Canton, Four, Plasma rally secures double-digit gains

Canton, Four, and Plasma are the top-performing crypto assets over the last 24 hours with double-digit gains. The extended recovery in Canton is gaining traction while Four and Plasma target a decisive close above the 200-period Exponential Moving Average on the 4-hour chart.

Economic outlook 2026-2027 in advanced countries: Solidity test

After a year marked by global economic resilience and ending on a note of optimism, 2026 looks promising and could be a year of solid economic performance. In our baseline scenario, we expect most of the supportive factors at work in 2025 to continue to play a role in 2026.

Crypto market outlook for 2026

Year 2025 was volatile, as crypto often is.  Among positive catalysts were favourable regulatory changes in the U.S., rise of Digital Asset Treasuries (DAT), adoption of AI and tokenization of Real-World-Assets (RWA).