GBP/USD heads into the Friday endzone grasping for 1.2550
- GBP/USD hits a new low on Friday after a week of rough downside action.
- Next week sees back-to-back central bank appearances from the Fed and BoE.
- Downside momentum remains a key risk for the GBP heading into the year's final CB rate calls.

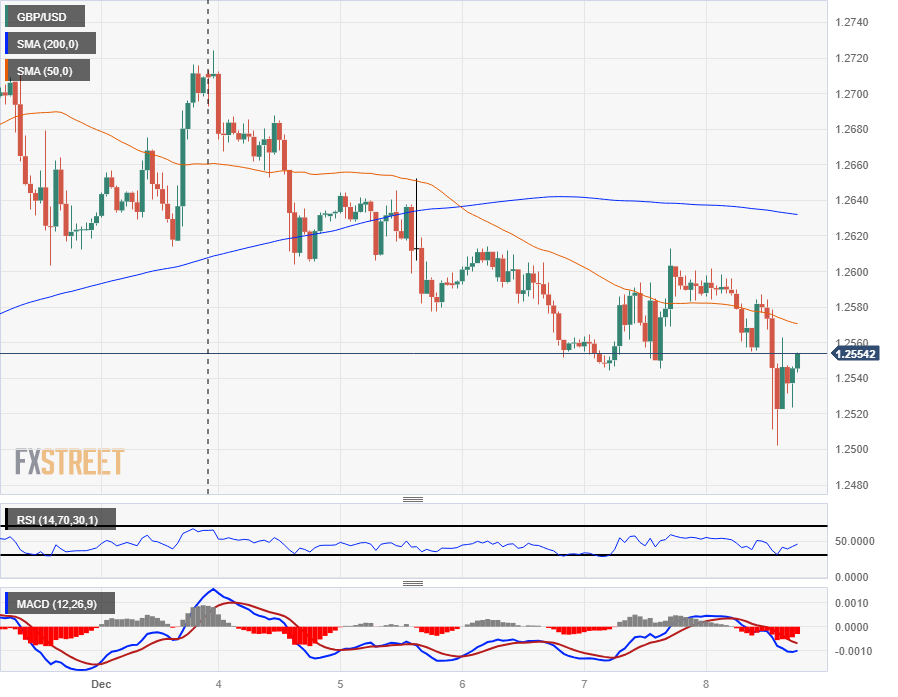
The GBP/USD is trying to hold onto 1.2550 heading into the Friday market close after dropping into a new low for the week near the 1.2500 handle after a better-than-expected US Nonfarm Payrolls (NFP) gave the US Dollar (USD) one last bump across the board to round out the trading week.
The Pound Sterling (GBP) spent most of the week underwater, waffling against its higher-profile peers and seeing only moderate gains against its weaker competitors. The GBP/USD pair is down one and a third percent from Monday’s opening bids as US economic releases dominated the data docket this week with a thin showing from the UK.
Market reactions centered around Federal Reserve (Fed) positioning this week, with investors weighing increased odds of Fed rate cuts coming sooner rather than later on a case-by-case basis, flipping into and out of risk bids as US economic figures beat or miss market data forecasts from one release to the next.
US NFP beats the street, thin UK data keeps the GBP pinned
Friday ended on a USD-positive note after US Nonfarm Payrolls beat expectations once again, showing the US added a net 199K new jobs to the already-tight labor market, above the market forecast of 180K and climbing above October’s print of 150K payroll additions.
November’s ADP Employment Change released earlier in the week showed a below-expectation performance, with ADP reporting a slower pace of new payroll employees of 103K compared to October’s 106K and missing median market forecasts of 130K. The ADP pullback set up over-eager market participants for disappointment with investors leaning heavier into Fed rate cut bets on the back of softening pre-NFP labor data, but Friday’s employment beat muddied the rate expectations waters to wrap up the trading week.
Next week sees a slew of central bank action through the midweek, with the US Fed giving one last rate call for 2023 and updating their inflation outlook dot plot, to be followed by the Bank of England (BoE) and its latest interest rate decision. Both central banks are expected to keep interest rates steady to close out 2023, at 5.5% and 5.25% respectively.
Before central bank action gets underway, next Tuesday brings UK Average Earnings and Claimant Count Change figures; annualized quarterly average earnings are expected to decline from 7.7% to 7.4% in the third quarter, while November is expected to show a slight increase in the number of unemployment benefits seekers from 17.8K to 20.3K.
Pound Sterling price this week
The table below shows the percentage change of Pound Sterling (GBP) against listed major currencies this week. Pound Sterling was the weakest against the Japanese Yen.
| USD | EUR | GBP | CAD | AUD | JPY | NZD | CHF | |
| USD | 1.16% | 1.25% | 0.76% | 1.55% | -1.01% | 1.42% | 1.42% | |
| EUR | -1.18% | 0.10% | -0.40% | 0.39% | -2.22% | 0.28% | 0.26% | |
| GBP | -1.29% | -0.10% | -0.50% | 0.28% | -2.30% | 0.17% | 0.17% | |
| CAD | -0.76% | 0.41% | 0.51% | 0.80% | -1.79% | 0.68% | 0.67% | |
| AUD | -1.56% | -0.40% | -0.29% | -0.80% | -2.61% | -0.11% | -0.12% | |
| JPY | 0.95% | 2.15% | 2.40% | 1.77% | 2.55% | 2.42% | 2.40% | |
| NZD | -1.44% | -0.27% | -0.17% | -0.68% | 0.11% | -2.47% | 0.00% | |
| CHF | -1.46% | -0.26% | -0.17% | -0.67% | 0.11% | -2.46% | 0.00% |
The heat map shows percentage changes of major currencies against each other. The base currency is picked from the left column, while the quote currency is picked from the top row. For example, if you pick the Euro from the left column and move along the horizontal line to the Japanese Yen, the percentage change displayed in the box will represent EUR (base)/JPY (quote).
GBP/USD Technical Outlook
The Pound Sterling shed the 200-hour Simple Moving Average (SMA) early in the week, descending below the 1.2600 handle to remain capped on the low side for the rest of the trading week. The GBP/USD pressed into a new weekly low near 1.2500 on Friday, and heads into the market close struggling to hold onto 1.2550 below the 50-hour SMA.
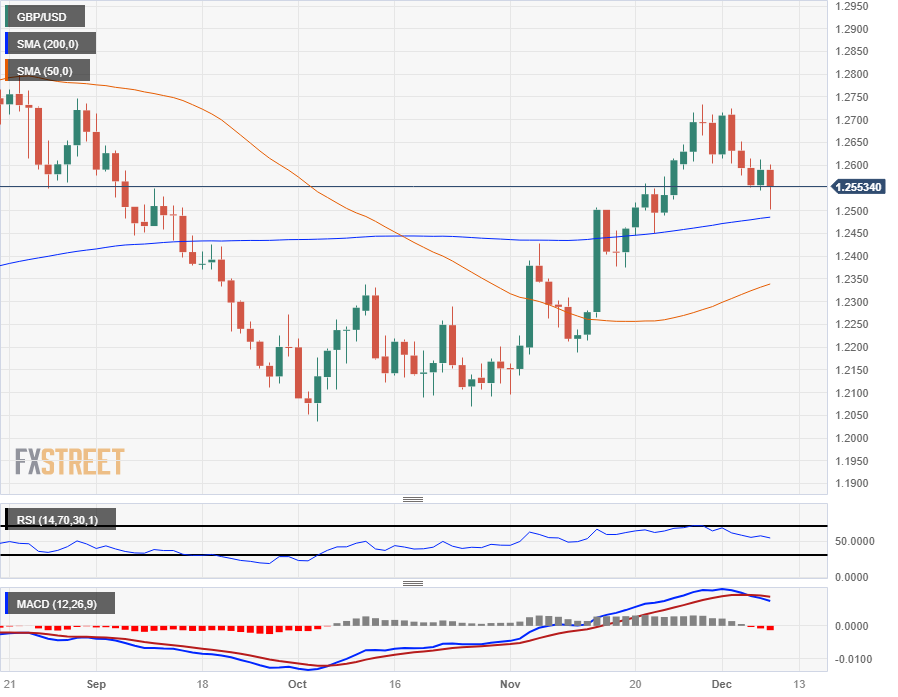
The GBP/USD fell 1.75% peak-to-trough on the week, and still remains down 1.33% despite a soft rebound from Friday’s new low, although GBP bulls will note that daily candlesticks are seeing technical support from the 200-day SMA rising into the 1.2500 handle, with the 50-day SMA accelerating into the upside from 1.2300.
Despite the week’s declines the GBP/USD is still up 4.3% from October’s early low of 1.2037, and the challenge for bullish bidders will be to stage a technical recovery and muscle the pair back over last week’s high bids just beyond the 1.2700 handle.
GBP/USD Hourly Chart
GBP/USD Daily Chart
GBP/USD Technical Levels
Author

Joshua Gibson
FXStreet
Joshua joins the FXStreet team as an Economics and Finance double major from Vancouver Island University with twelve years' experience as an independent trader focusing on technical analysis.