GBP/USD falls on US Dollar strength amid Fed rate hike speculations
- Greenback stages a comeback, boosted by higher US Treasury bond Yields
- Empire State Index surprises with 10.8 point jump in March’s report.
- GBP/USD Price Analysis: Double top emerges, but the pair must fall below 1.2344 to confirm the pattern.

GBP/USD dropped after forming a double top in recent price action during the last nine days and falls amidst speculations that the US Federal Reserve (Fed) would raise rates in May. That, alongside Fed Fund’s swaps, pushing the first rate cut by November of 2023, increased appetite for the greenback. Therefore, the GBP/USD is trading at 1.2355 after hitting a high of 1.2438.
Bets for May’s rate hike by the Fed underpins the US Dollar
US equities have turned read, while the greenback, as shown by the US Dollar Index (DXY), stages a comeback. The DXY sits at 102.214, gains 0.62%, and is one of the reasons for the GBP/USD pullback. Underpinned by traders bracing for additional tightening by the Fed, US Treasury bond yields are heading north, consequently bolstering the USD.
According to the CME FedWatch Tool, the probability of a 25 bps rate hike by the Fed stands at 84.7%, indicating an increase from last Friday’s 78%.
Earlier, a report by the New York Fed revealed that manufacturing activity in the region jumped, as shown by the Empire State Index, for March, advanced 10.8, above estimates of a -18 plunge. A rise in orders and shipments underpinned the data.
Given the backdrop, the GBP/USD retreated from daily highs at 1.2438 and extended its losses towards the S1 daily pivot at 1.2359, shy of last week’s low of 1.2344.
On the United Kingdom (UK) docket, Bank of England (BoE) Deputy Governor Jon Cunliffe crossed newswires. Cunliffe focused on digital currencies and said, “Systemic stablecoins will need to be backed with high quality and liquid assets,” and added that it would not be possible to protect stablecoin deposits in the case of failure.;
What to watch?
The UK calendar will feature the important jobs report, with Employment Change, expected at 50K and the Unemployment Rate unchanged at 3.7%. On the US front, the docket will feature Building Permits, Housing Starts, and Federal Reserve Governor Michell Bowman speaking.
GBP/USD Technical Analysis
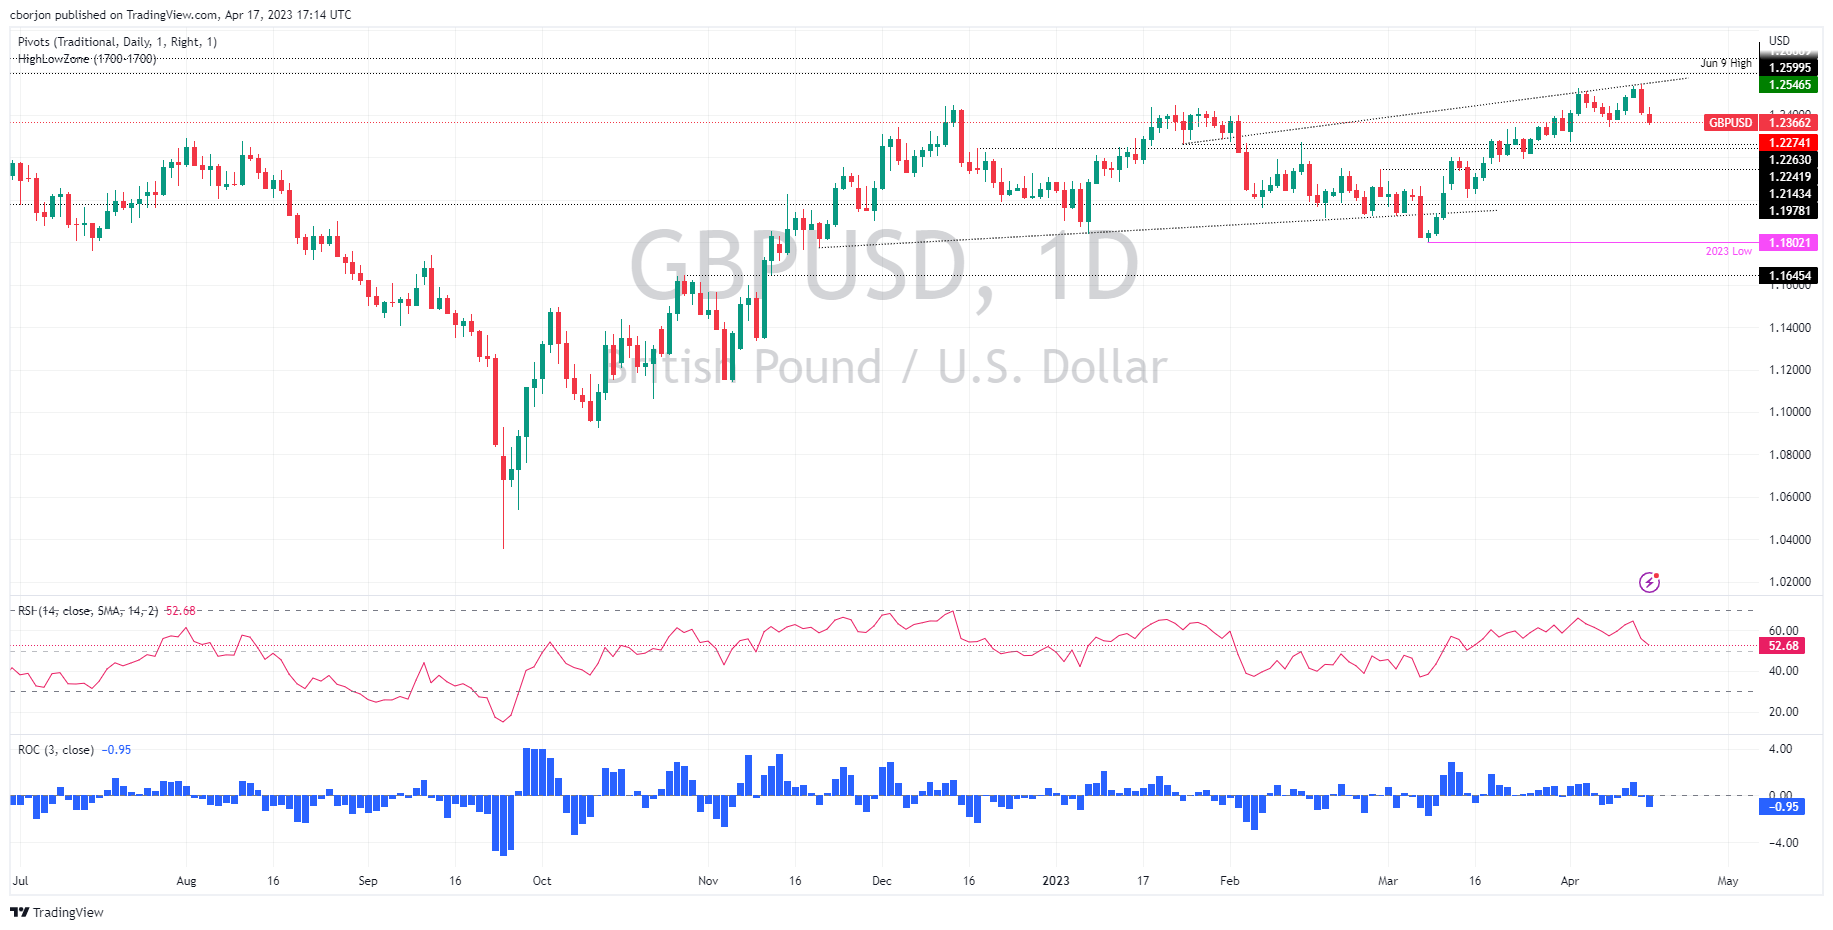
A double-top chart pattern is beginning to emerge in the GBP/USD daily chart. Nevertheless, a break below April’s 10 cycle low at 1.2344 is needed to validate the pattern. An initial price target would be 1.2144, but the GBP/USD must hurdle some demand areas toward the latter. First, the April 3 daily low at 1.2274, followed by the 1.2200 figure, ahead of February’s 28 high, turned support at 1.2144.
Author

Christian Borjon Valencia
FXStreet
Markets analyst, news editor, and trading instructor with over 14 years of experience across FX, commodities, US equity indices, and global macro markets.


